

Above is a graph of the pressure as a function of the volume that the gas occupies.
Fantastic news! We've Found the answer you've been seeking!
Question:
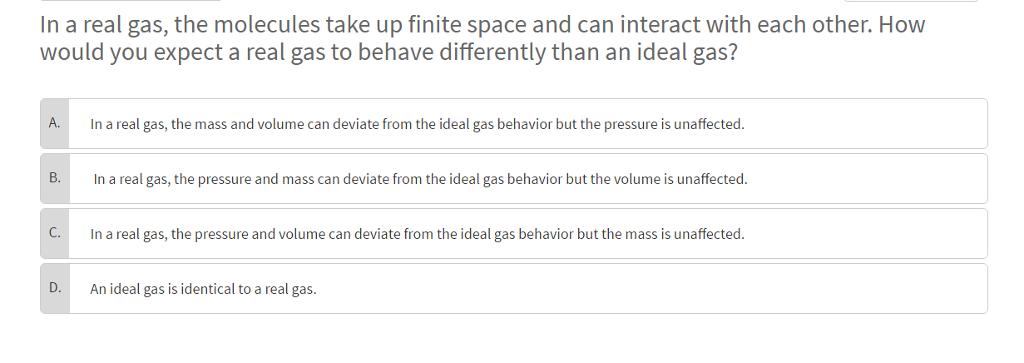
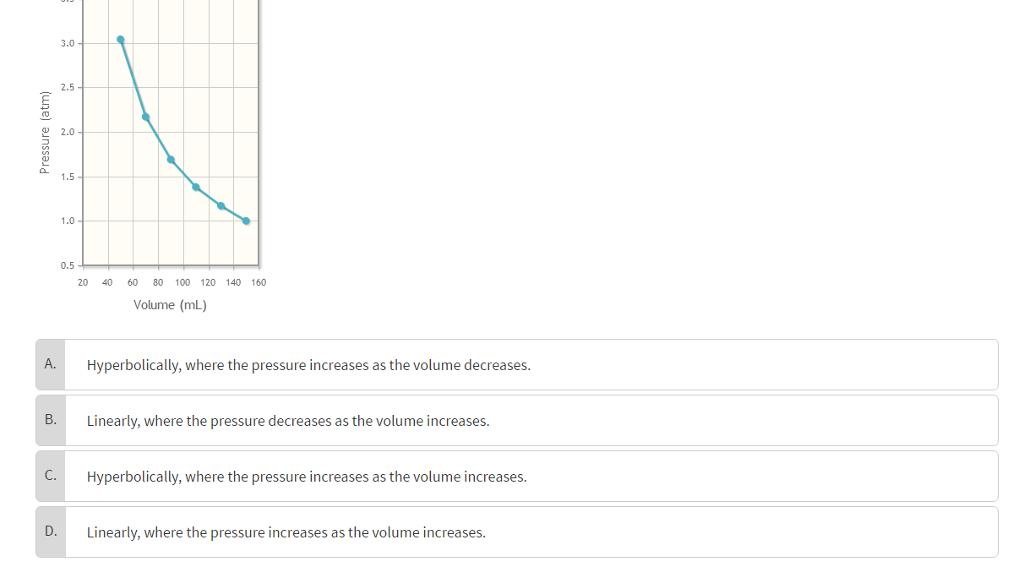
Above is a graph of the pressure as a function of the volume that the gas occupies. How does the data appear to be related?
Expert Answer:
The answer to the first question is Option C in a real gas the pressure and volume ... View the full answer

Related Book For 

International Economics Theory and Policy
ISBN: 978-0273754206
9th Edition
Authors: Paul R. Krugman, Maurice Obstfeld, Marc J. Melitz
Posted Date:
