

Question: In a situation, where inflows and outflows are not synchronized during the month, it likely to be possible to use a cash budget centered on
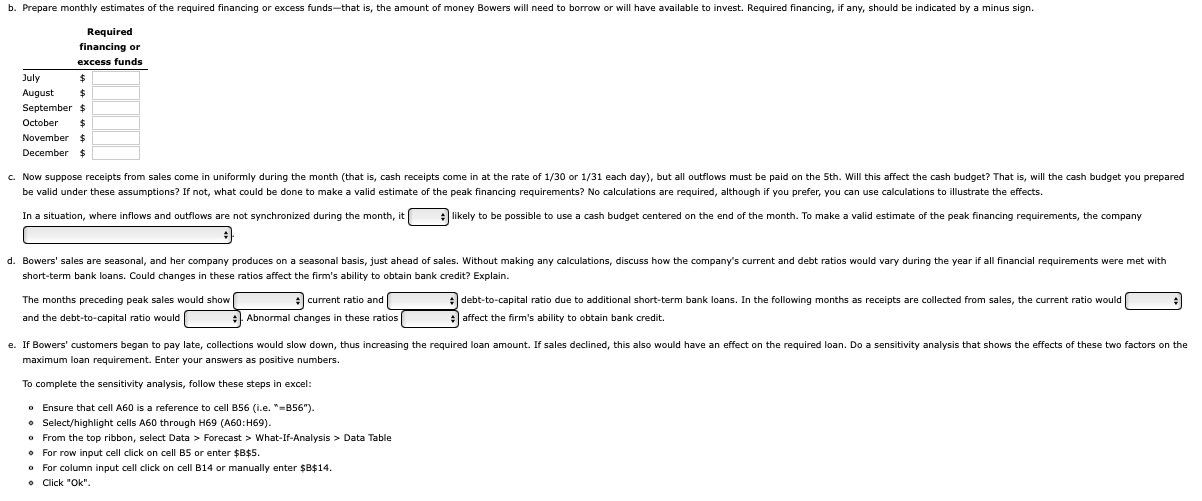
In a situation, where inflows and outflows are not synchronized during the month, it likely to be possible to use a cash budget centered on the end of the month. To make a valid estimate of the peak financing requirements, the company short-term bank loans. Could changes in these ratios affect the firm's ability to obtain bank credit? Explain. The months preceding peak sales would show current ratio and debt-to-capital ratio due to additional short-term bank loans. In the following months as receipts are collected from sales, the current ratio would and the debt-to-capital ratio would Abnormal changes in these ratios affect the firm's ability to obtain bank credit. maximum loan requirement. Enter your answers as positive numbers. To complete the sensitivity analysis, follow these steps in excel: - Ensure that cell A60 is a reference to cell B56 (i.e. " =B56n ). - Select/highlight cells A60 through H69 (A60:H69). - From the top ribbon, select Data > Forecast > What-If-Analysis > Data Table - For row input cell click on cell B5 or enter $B$5. - For column input cell click on cell B14 or manually enter $B$14. In a situation, where inflows and outflows are not synchronized during the month, it likely to be possible to use a cash budget centered on the end of the month. To make a valid estimate of the peak financing requirements, the company short-term bank loans. Could changes in these ratios affect the firm's ability to obtain bank credit? Explain. The months preceding peak sales would show current ratio and debt-to-capital ratio due to additional short-term bank loans. In the following months as receipts are collected from sales, the current ratio would and the debt-to-capital ratio would Abnormal changes in these ratios affect the firm's ability to obtain bank credit. maximum loan requirement. Enter your answers as positive numbers. To complete the sensitivity analysis, follow these steps in excel: - Ensure that cell A60 is a reference to cell B56 (i.e. " =B56n ). - Select/highlight cells A60 through H69 (A60:H69). - From the top ribbon, select Data > Forecast > What-If-Analysis > Data Table - For row input cell click on cell B5 or enter $B$5. - For column input cell click on cell B14 or manually enter $B$14
Step by Step Solution
There are 3 Steps involved in it

Get step-by-step solutions from verified subject matter experts