

Question: In a soil compaction test, the following data was collected; Water content of sample ( % ) 9 . 3 1 1 . 8 1
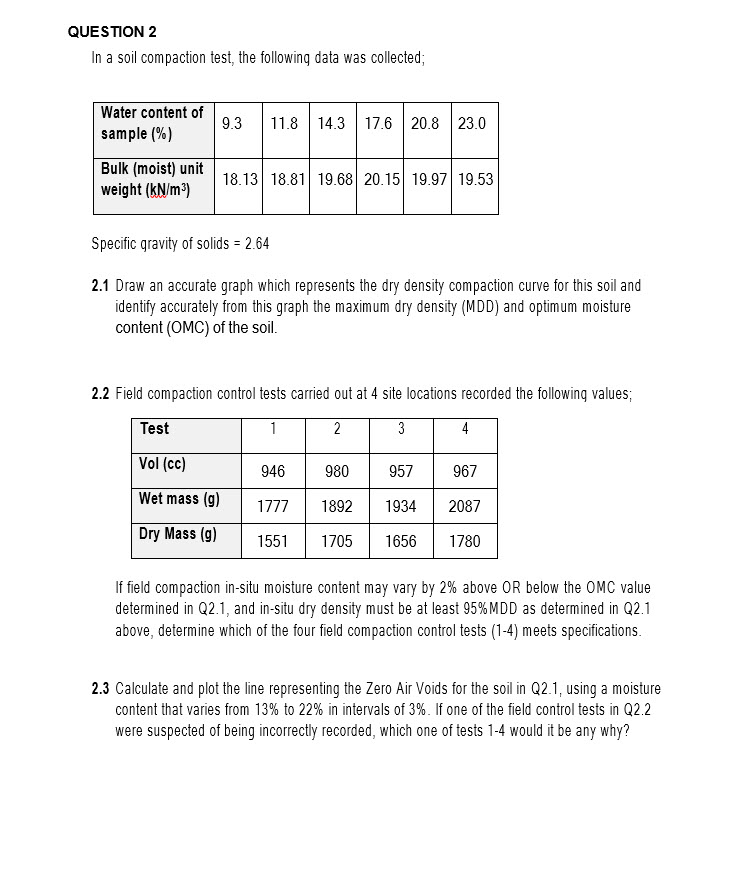
In a soil compaction test, the following data was collected;
Water content of sample
Bulk moist unit weight kNm
Specific gravity of solids
Draw an accurate graph which represents the dry density compaction curve for this soil and identify accurately from this graph the maximum dry density MDD and optimum moisture content OMC of the soil.
Field compaction control tests carried out at site locations recorded the following values;
Test
Vol cc
Wet mass g
Dry Mass g
If field compaction insitu moisture content may vary by above OR below the OMC value determined in Q and insitu dry density must be at least MDD as determined in Q above, determine which of the four field compaction control tests meets specifications.
Calculate and plot the line representing the Zero Air Voids for the soil in Q using a moisture content that varies from to in intervals of If one of the field control tests in Q were suspected of being incorrectly recorded, which one of tests would it be any why?
Step by Step Solution
There are 3 Steps involved in it
1 Expert Approved Answer
Step: 1 Unlock

Question Has Been Solved by an Expert!
Get step-by-step solutions from verified subject matter experts
Step: 2 Unlock
Step: 3 Unlock