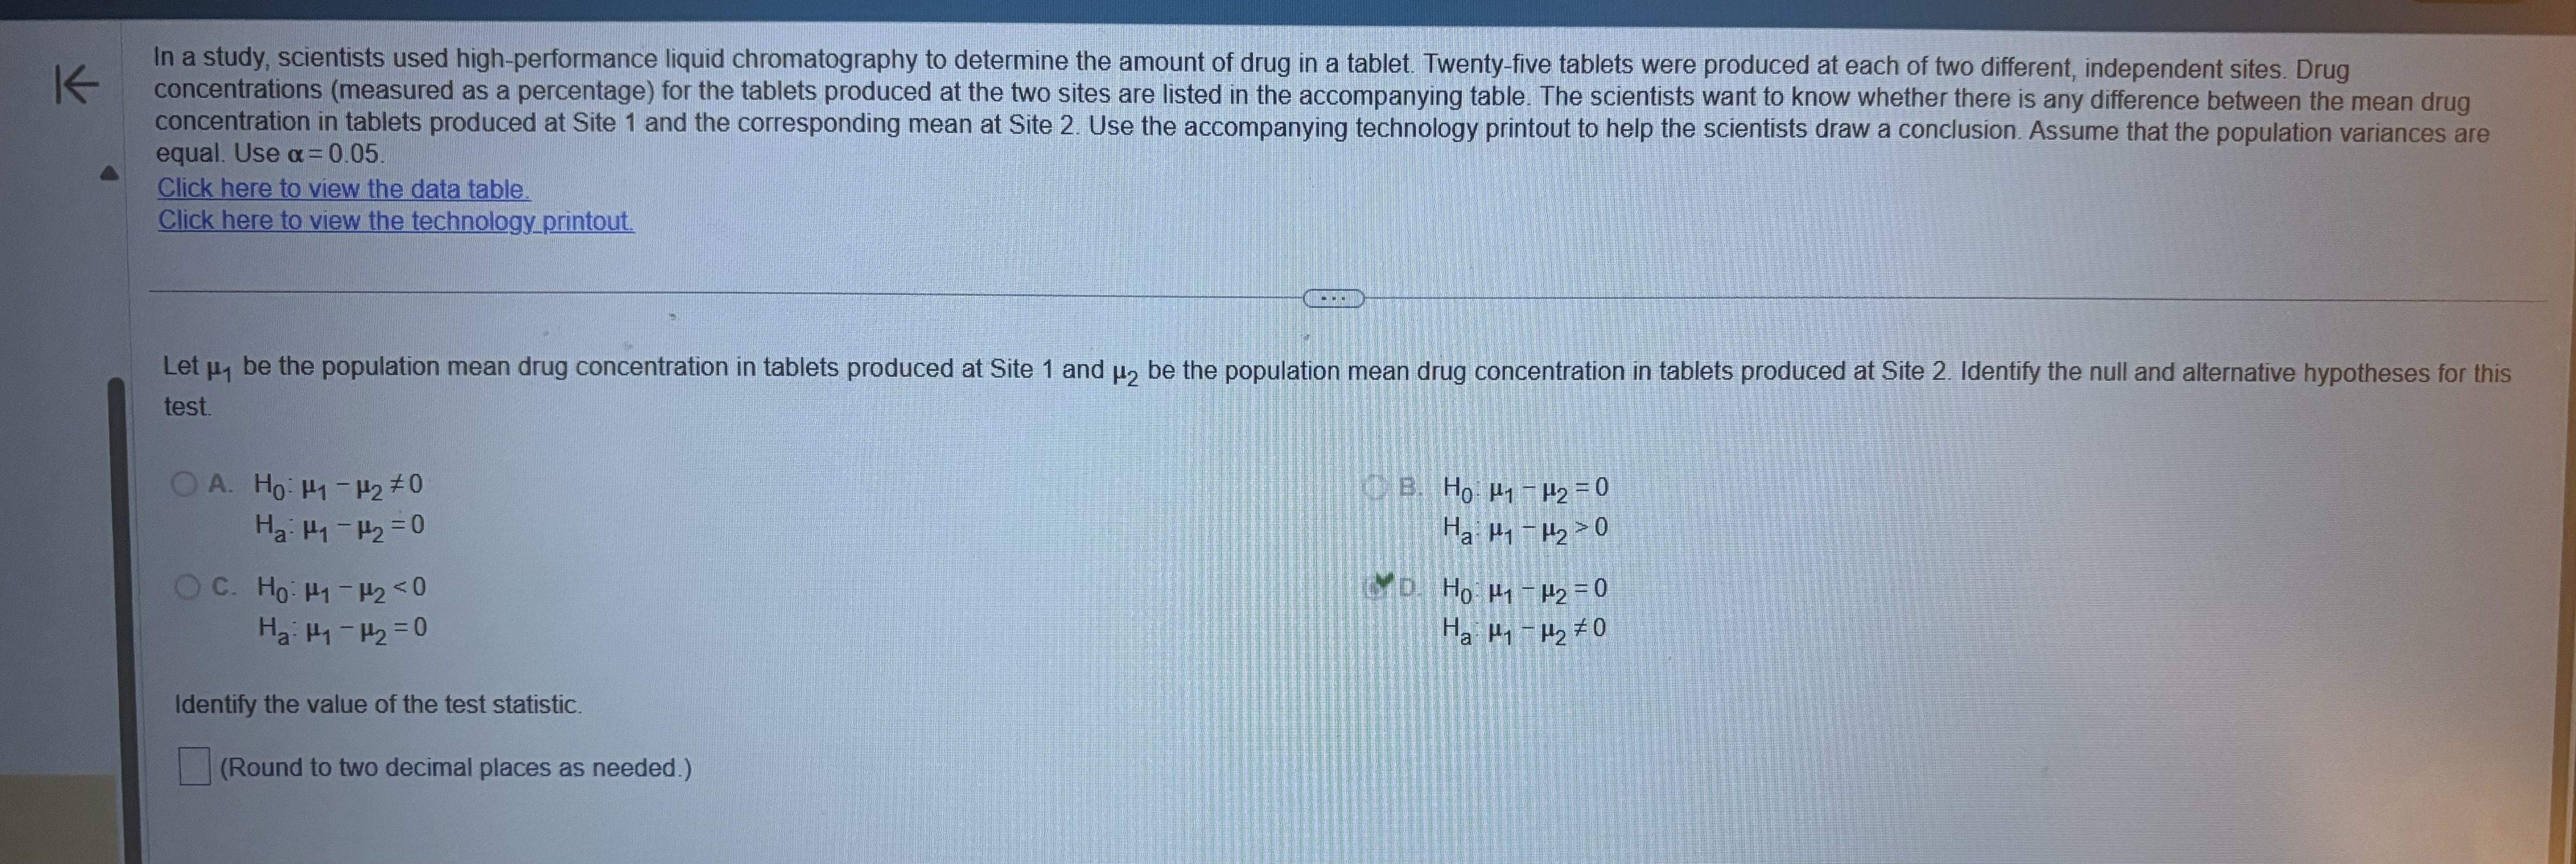
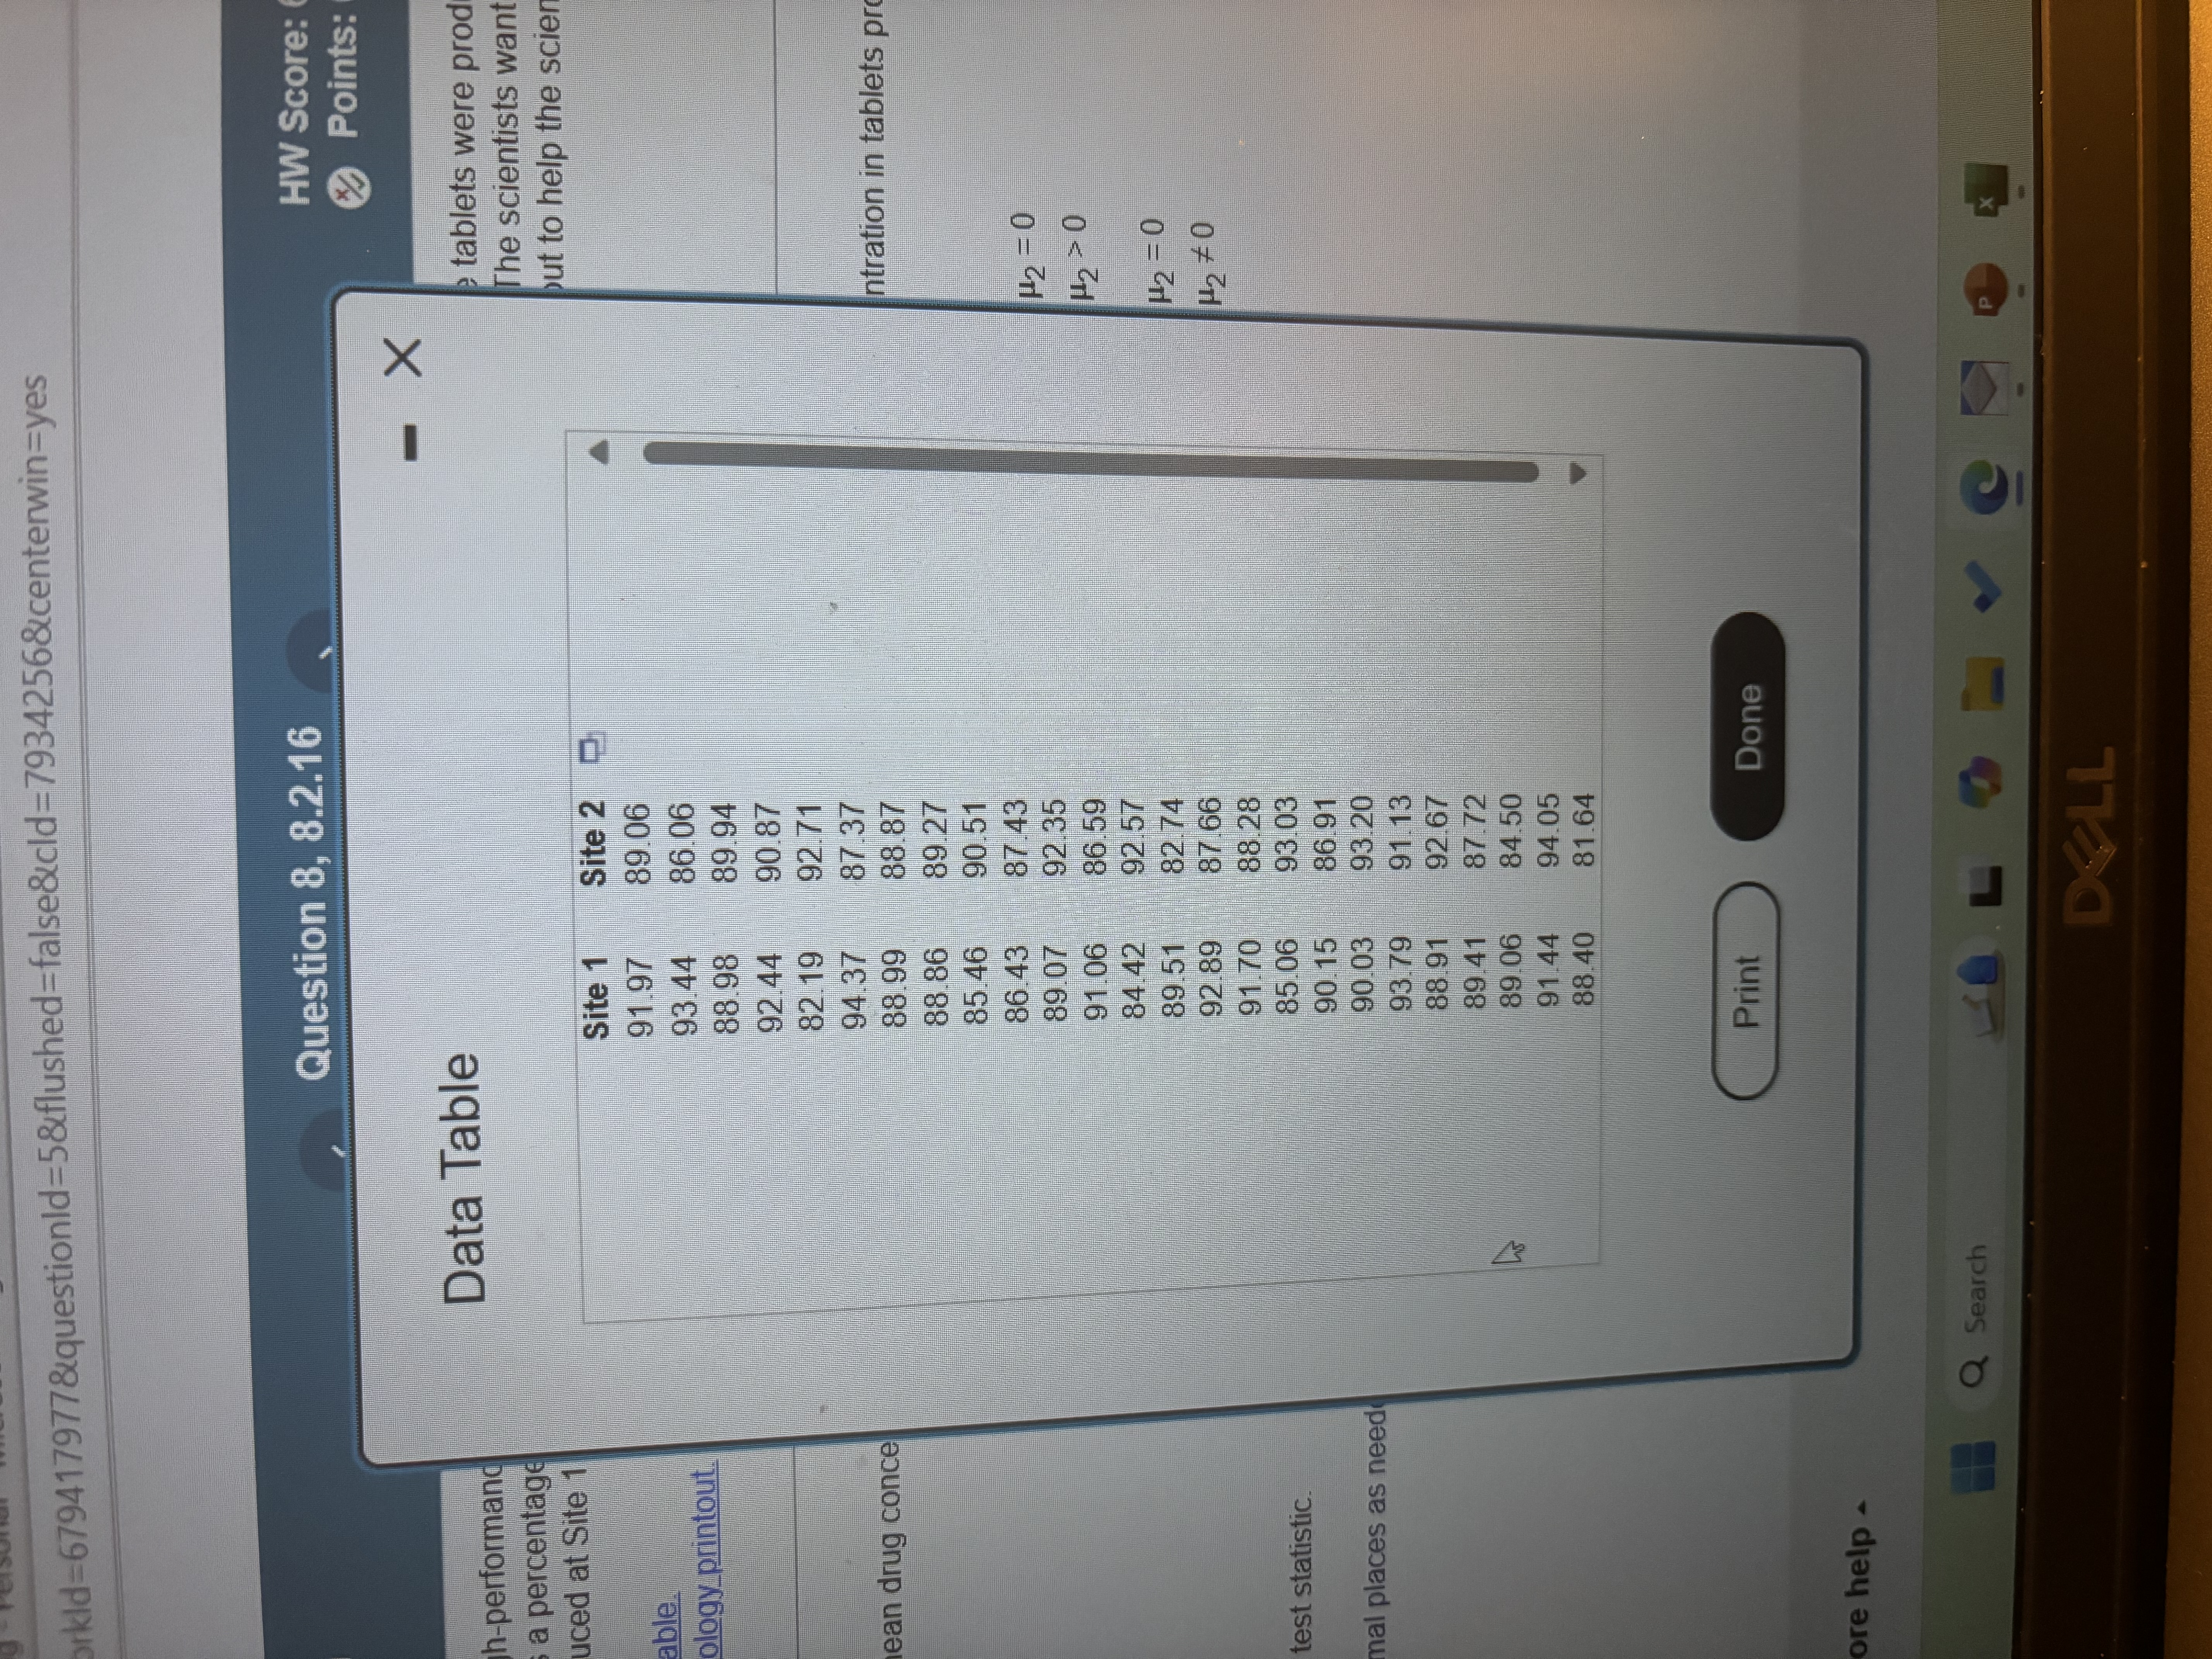
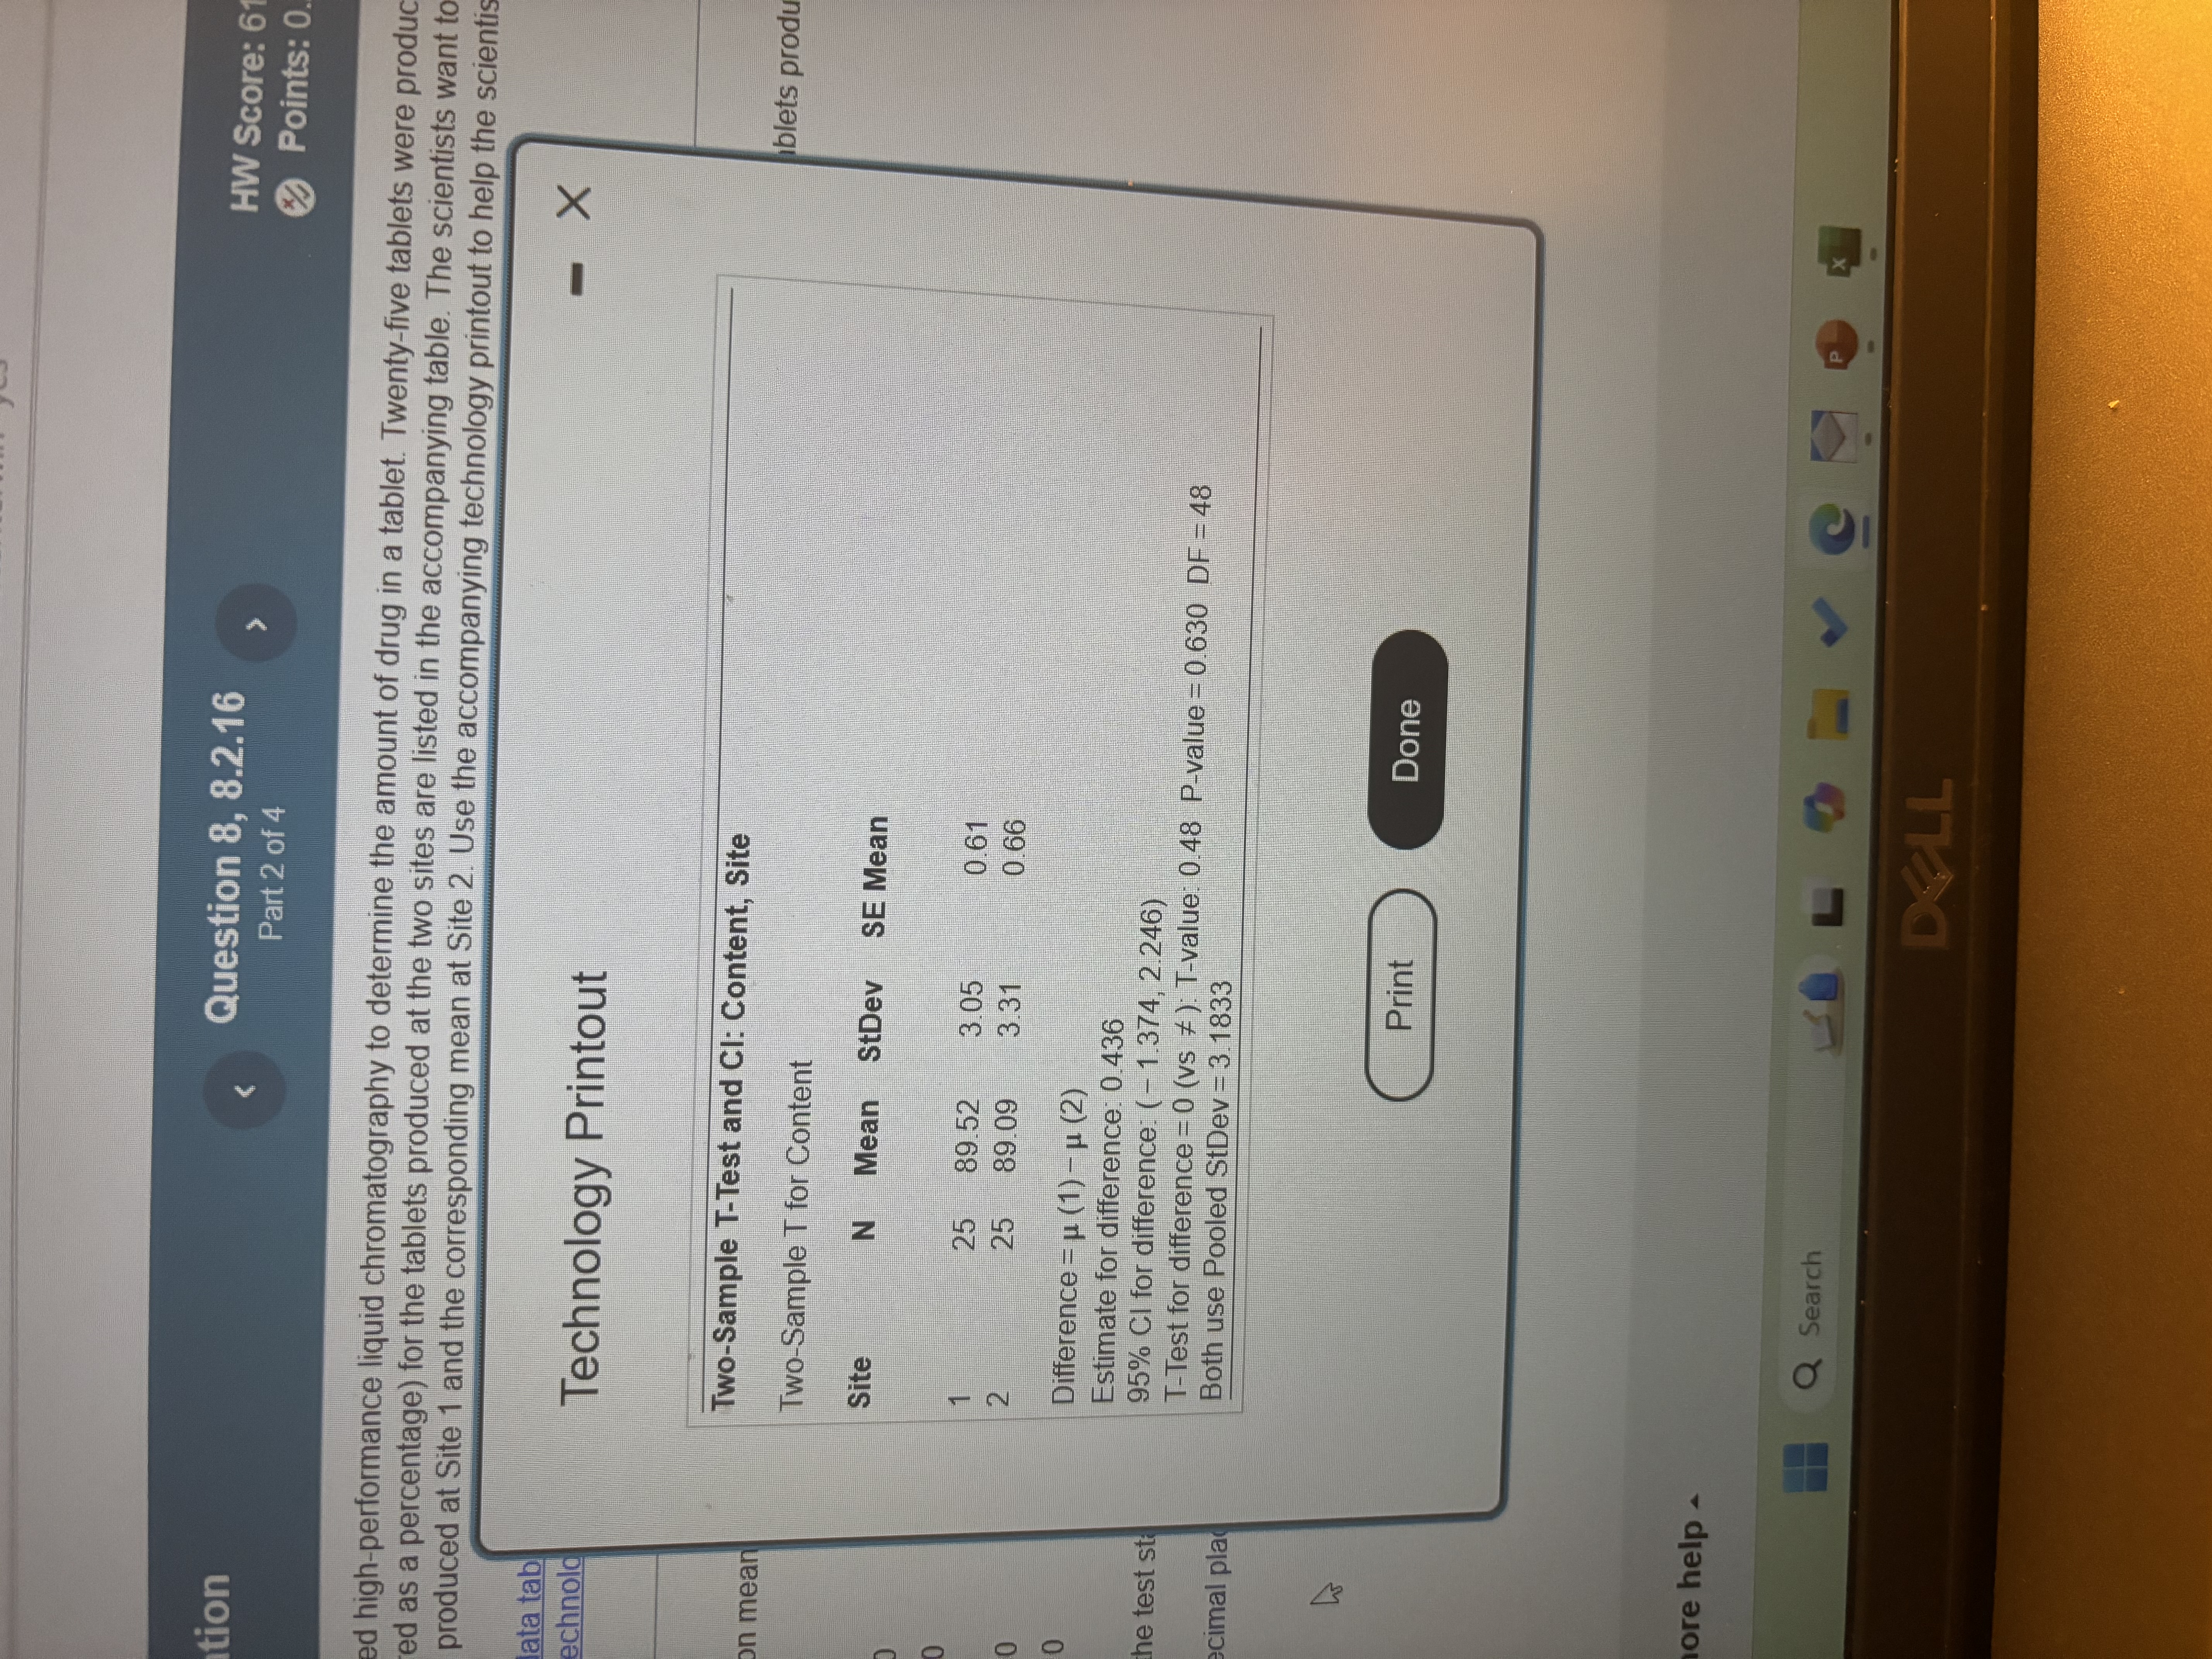
Question: In a study, scientists used high-performance liquid chromatography to determine the amount of drug in a tablet. Twenty-five tablets were produced at each of two

In a study, scientists used high-performanceIn a study, scientists used high-performanceIn a study, scientists used high-performance
In a study, scientists used high-performance liquid chromatography to determine the amount of drug in a tablet. Twenty-five tablets were produced at each of two different, independent sites. Drug K concentrations (measured as a percentage) for the tablets produced at the two sites are listed in the accompanying table. The scientists want to know whether there is any difference between the mean drug concentration in tablets produced at Site 1 and the corresponding mean at Site 2. Use the accompanying technology printout to help the scientists draw a conclusion. Assume that the population variances are equal. Use a = 0.05. Click here to view the data table. Click here to view the technology printout. Let uy be the population mean drug concentration in tablets produced at Site 1 and u2 be the population mean drug concentration in tablets produced at Site 2. Identify the null and alternative hypotheses for this test OA. HO: My - 12 # 0 B. HO H1 - H2 = 0 Ha: My - 12= 0 Ha H1 - 12 20 O C. Ho: My - 12 0 84.42 92.57 89.51 82.74 H2 = 0 92.89 87.66 H2 + 0 91.70 88.28 test statistic. 85.06 93 03 90.15 86.91 nal places as need 90.03 93.20 93.79 91 13 88.91 92.67 89.41 87.72 89 06 84.50 91 44 94.05 88.40 81.64 Print Done ore help - Q Search V Ption Question 8, 8.2.16 HW Score: 6 Part 2 of 4 Points: 0. ed high-performance liquid chromatography to determine the amount of drug in a tablet. Twenty-five tablets were produc ed as a percentage) for the tablets produced at the two sites are listed in the accompanying table. The scientists want to produced at Site 1 and the corresponding mean at Site 2. Use the accompanying technology printout to help the scienti ata tab X echnold Technology Printout Two-Sample T-Test and CI: Content, Site on mean blets produ Two-Sample T for Content Site N Mean StDev SE Mean 25 89.52 3.05 0.61 2 25 89.09 3.31 0.66 Difference = p (1) -p (2) Estimate for difference: 0.436 he test st 95% CI for difference: ( - 1.374, 2 246) T-Test for difference = 0 (vs # ) T-value: 0.48 P-value = 0.630 DF =48 cimal plac Both use Pooled StDev = 3.1833 Print Done ore help - Q Search V X DELL

Step by Step Solution

There are 3 Steps involved in it

1 Expert Approved Answer
Step: 1 Unlock blur-text-image
Question Has Been Solved by an Expert!

Get step-by-step solutions from verified subject matter experts

Step: 2 Unlock
Step: 3 Unlock

Students Have Also Explored These Related Mathematics Questions!