

In a survey of women in a certain country (ages 20 - 29), the mean height...
Fantastic news! We've Found the answer you've been seeking!
Question:
Transcribed Image Text:
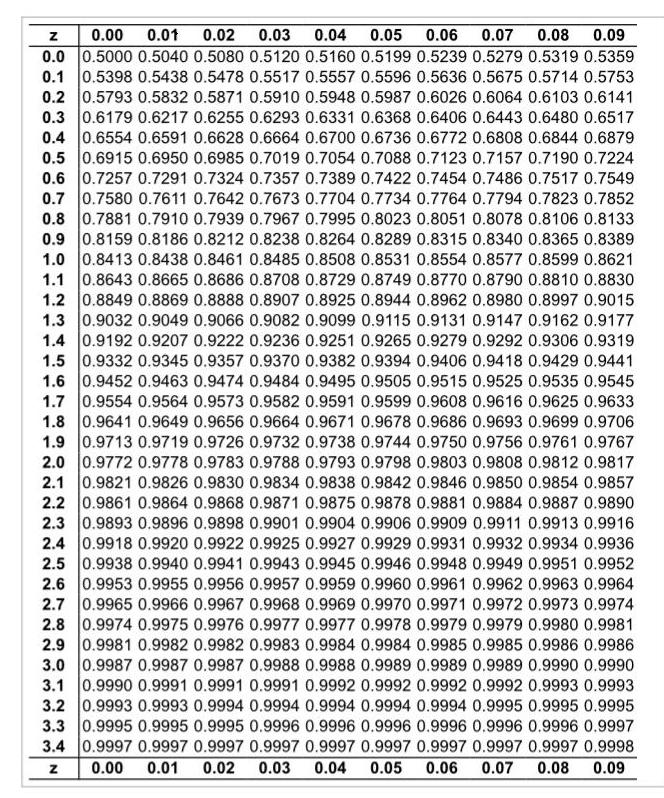
In a survey of women in a certain country (ages 20 - 29), the mean height was 64.3 inches with a standard deviation of 2.75 inches. Answer the following questions about the specified normal distribution. (a) What height represents the 95th percentile? (b) What height represents the first quartile? Click to view page 1 of the table. Click to view page 2 of the table. 0.00 0.01 0.02 0.03 0.04 0.05 0.06 0.07 0.08 0.09 0.0 0.5000 0.5040 0.5080 0.5120 0.5160 0.5199 0.5239 0.5279 0.5319 0.5359 0.1 0.5398 0.5438 0.5478 0.5517 0.5557 0.5596 0.5636 0.5675 0.5714 0.5753 0.2 0.5793 0.5832 0.5871 0.5910 0.5948 0.5987 0.6026 0.6064 0.6103 0.6141 0.3 0.6179 0.6217 0.6255 0.6293 0.6331 0.6368 0.6406 0.6443 0.6480 0.6517 0.4 0.6554 0.6591 0.6628 0.6664 0.6700 0.6736 0.6772 0.6808 0.6844 0.6879 0.5 0.6915 0.6950 0.6985 0.7019 0.7054 0.7088 0.7123 0.7157 0.7190 0.7224 0.6 0.7257 0.7291 0.7324 0.7357 0.7389 0.7422 0.7454 0.7486 0.7517 0.7549 0.7 0.7580 0.7611 0.7642 0.7673 0.7704 0.7734 0.7764 0.7794 0.7823 0.7852 0.8 0.7881 0.7910 0.7939 0.7967 0.7995 0.8023 0.8051 0.8078 0.8106 0.8133 0.9 0.8159 0.8186 0.8212 0.8238 0.8264 0.8289 0.8315 0.8340 0.8365 0.8389 1.0 0.8413 0.8438 0.8461 0.8485 0.8508 0.8531 0.8554 0.8577 0.8599 0.8621 1.1 0.8643 0.8665 0.8686 0.8708 0.8729 0.8749 0.8770 0.8790 0.8810 0.8830 1.2 0.8849 0.8869 0.8888 0.8907 0.8925 0.8944 0.8962 0.8980 0.8997 0.9015 1.3 0.9032 0.9049 0.9066 0.9082 0.9099 0.9115 0.9131 0.9147 0.9162 0.9177 1.4 0.9192 0.9207 0.9222 0.9236 0.9251 0.9265 0.9279 0.9292 0.9306 0.9319 1.5 0.9332 0.9345 0.9357 0.9370 0.9382 0.9394 0.9406 0.9418 0.9429 0.9441 1.6 0.9452 0.9463 0.9474 0.9484 0.9495 0.9505 0.9515 0.9525 0.9535 0.9545 1.7 0.9554 0.9564 0.9573 0.9582 0.9591 0.9599 0.9608 0.9616 0.9625 0.9633 1.8 0.9641 0.9649 0.9656 0.9664 0.9671 0.9678 0.9686 0.9693 0.9699 0.9706 1.9 0.9713 0.9719 0.9726 0.9732 0.9738 0.9744 0.9750 0.9756 0.9761 0.9767 2.0 0.9772 0.9778 0.9783 0.9788 0.9793 0.9798 0.9803 0.9808 0.9812 0.9817 2.1 0.9821 0.9826 0.9830 0.9834 0.9838 0.9842 0.9846 0.9850 0.9854 0.9857 2.2 0.9861 0.9864 0.9868 0.9871 0.9875 0.9878 0.9881 0.9884 0.9887 0.9890 2.3 0.9893 0.9896 0.9898 0.9901 0.9904 0.9906 0.9909 0.9911 0.9913 0.9916 2.4 0.9918 0.9920 0.9922 0.9925 0.9927 0.9929 0.9931 0.9932 0.9934 0.9936 2.5 0.9938 0.9940 0.9941 0.9943 0.9945 0.9946 0.9948 0.9949 0.9951 0.9952 2.6 0.9953 0.9955 0.9956 0.9957 0.9959 0.9960 0.9961 0.9962 0.9963 0.9964 2.7 0.9965 0.9966 0.9967 0.9968 0.9969 0.9970 0.9971 0.9972 0.9973 0.9974 2.8 0.9974 0.9975 0.9976 0.9977 0.9977 0.9978 0.9979 0.9979 0.9980 0.9981 2.9 0.9981 0.9982 0.9982 0.9983 0.9984 0.9984 0.9985 0.9985 0.9986 0.9986 3.0 0.9987 0.9987 0.9987 0.9988 0.9988 0.9989 0.9989 0.9989 0.9990 0.9990 3.1 0.9990 0.9991 0.9991 0.9991 0.9992 0.9992 0.9992 0.9992 0.9993 0.9993 3.2 0.9993 0.9993 0.9994 0.9994 0.9994 0.9994 0.9994 0.9995 0.9995 0.9995 3.3 0.9995 0.9995 0.9995 0.9996 0.9996 0.9996 0.9996 0.9996 0.9996 0.9997 3.4 0.9997 0.9997 0.9997 0.9997 0.9997 0.9997 0.9997 0.9997 0.9997 0.9998 0.00 0.01 0.02 0.03 0.04 0.05 0.06 0.07 0.08 0.09 In a survey of women in a certain country (ages 20 - 29), the mean height was 64.3 inches with a standard deviation of 2.75 inches. Answer the following questions about the specified normal distribution. (a) What height represents the 95th percentile? (b) What height represents the first quartile? Click to view page 1 of the table. Click to view page 2 of the table. 0.00 0.01 0.02 0.03 0.04 0.05 0.06 0.07 0.08 0.09 0.0 0.5000 0.5040 0.5080 0.5120 0.5160 0.5199 0.5239 0.5279 0.5319 0.5359 0.1 0.5398 0.5438 0.5478 0.5517 0.5557 0.5596 0.5636 0.5675 0.5714 0.5753 0.2 0.5793 0.5832 0.5871 0.5910 0.5948 0.5987 0.6026 0.6064 0.6103 0.6141 0.3 0.6179 0.6217 0.6255 0.6293 0.6331 0.6368 0.6406 0.6443 0.6480 0.6517 0.4 0.6554 0.6591 0.6628 0.6664 0.6700 0.6736 0.6772 0.6808 0.6844 0.6879 0.5 0.6915 0.6950 0.6985 0.7019 0.7054 0.7088 0.7123 0.7157 0.7190 0.7224 0.6 0.7257 0.7291 0.7324 0.7357 0.7389 0.7422 0.7454 0.7486 0.7517 0.7549 0.7 0.7580 0.7611 0.7642 0.7673 0.7704 0.7734 0.7764 0.7794 0.7823 0.7852 0.8 0.7881 0.7910 0.7939 0.7967 0.7995 0.8023 0.8051 0.8078 0.8106 0.8133 0.9 0.8159 0.8186 0.8212 0.8238 0.8264 0.8289 0.8315 0.8340 0.8365 0.8389 1.0 0.8413 0.8438 0.8461 0.8485 0.8508 0.8531 0.8554 0.8577 0.8599 0.8621 1.1 0.8643 0.8665 0.8686 0.8708 0.8729 0.8749 0.8770 0.8790 0.8810 0.8830 1.2 0.8849 0.8869 0.8888 0.8907 0.8925 0.8944 0.8962 0.8980 0.8997 0.9015 1.3 0.9032 0.9049 0.9066 0.9082 0.9099 0.9115 0.9131 0.9147 0.9162 0.9177 1.4 0.9192 0.9207 0.9222 0.9236 0.9251 0.9265 0.9279 0.9292 0.9306 0.9319 1.5 0.9332 0.9345 0.9357 0.9370 0.9382 0.9394 0.9406 0.9418 0.9429 0.9441 1.6 0.9452 0.9463 0.9474 0.9484 0.9495 0.9505 0.9515 0.9525 0.9535 0.9545 1.7 0.9554 0.9564 0.9573 0.9582 0.9591 0.9599 0.9608 0.9616 0.9625 0.9633 1.8 0.9641 0.9649 0.9656 0.9664 0.9671 0.9678 0.9686 0.9693 0.9699 0.9706 1.9 0.9713 0.9719 0.9726 0.9732 0.9738 0.9744 0.9750 0.9756 0.9761 0.9767 2.0 0.9772 0.9778 0.9783 0.9788 0.9793 0.9798 0.9803 0.9808 0.9812 0.9817 2.1 0.9821 0.9826 0.9830 0.9834 0.9838 0.9842 0.9846 0.9850 0.9854 0.9857 2.2 0.9861 0.9864 0.9868 0.9871 0.9875 0.9878 0.9881 0.9884 0.9887 0.9890 2.3 0.9893 0.9896 0.9898 0.9901 0.9904 0.9906 0.9909 0.9911 0.9913 0.9916 2.4 0.9918 0.9920 0.9922 0.9925 0.9927 0.9929 0.9931 0.9932 0.9934 0.9936 2.5 0.9938 0.9940 0.9941 0.9943 0.9945 0.9946 0.9948 0.9949 0.9951 0.9952 2.6 0.9953 0.9955 0.9956 0.9957 0.9959 0.9960 0.9961 0.9962 0.9963 0.9964 2.7 0.9965 0.9966 0.9967 0.9968 0.9969 0.9970 0.9971 0.9972 0.9973 0.9974 2.8 0.9974 0.9975 0.9976 0.9977 0.9977 0.9978 0.9979 0.9979 0.9980 0.9981 2.9 0.9981 0.9982 0.9982 0.9983 0.9984 0.9984 0.9985 0.9985 0.9986 0.9986 3.0 0.9987 0.9987 0.9987 0.9988 0.9988 0.9989 0.9989 0.9989 0.9990 0.9990 3.1 0.9990 0.9991 0.9991 0.9991 0.9992 0.9992 0.9992 0.9992 0.9993 0.9993 3.2 0.9993 0.9993 0.9994 0.9994 0.9994 0.9994 0.9994 0.9995 0.9995 0.9995 3.3 0.9995 0.9995 0.9995 0.9996 0.9996 0.9996 0.9996 0.9996 0.9996 0.9997 3.4 0.9997 0.9997 0.9997 0.9997 0.9997 0.9997 0.9997 0.9997 0.9997 0.9998 0.00 0.01 0.02 0.03 0.04 0.05 0.06 0.07 0.08 0.09
Expert Answer:

Related Book For 

Posted Date:
Students also viewed these mathematics questions
-
In a survey of women in the United States (ages 20 29), the mean height was 64.2 inches with a standard deviation of 2.9 inches. (a) What height represents the 95th percentile? (b) What height...
-
In a sample of 20 men, the mean height was 178 cm. In a sample of 30 women, the mean height was 164 cm. What was the mean height for both groups put together?
-
Answer the following questions about prepaid expenses: a. On March 1, Blue & Green Travel prepaid $4,800 for six months rent. Give the adjusting entry to record rent expense at March 31. Include the...
-
By a work sampling study: Observed Data The machine is being used Proportion of manual labour (machine is running and/or (servicing time) T-% machine is random serviced) Allowance Time Proportion of...
-
Why might inflation be inertial?
-
The seasonal yield of olives in a Piraeus, Greece vineyard is greatly influenced by a process of branch pruning. If olive trees are pruned every two weeks, output is increased. The pruning process,...
-
Texas Inpatient Consultants, LLLP, is a partnership that employs physicians to deliver medical care to hospitalized patients of other physicians. Texas Inpatient recruited Julius Tabe, M.D., to work...
-
Jupiter Company sells goods on January 1 that have a cost of $500,000 to Danone Inc. for $700,000, with payment due in 1 year. The cash price for these goods is $610,000, with payment due in 30 days....
-
Consider the Solow model we studied in class, with the production function given by: Y =AKN1. tttt In this question, we distinguish between the labor force (L) and the total population (Pop). The...
-
A firm is analyzing their pricing and operations for next year based on the following anticipated cost structure, the given level of production and sales, and their target operating income margin of...
-
7. a) What is the purpose of using MnO, in gas analysis in the molar volume experiment ? (5p) b) Why do we choose molar volume method to determine the amount of a gas? (5p)
-
Occupancy for a hospital The Valley Hospital measures the in-patient occupancy of the hospital by determining the number of patient days divided by the number of available bed days in the hospital...
-
Kelsy is retiring at the end of the year and plans to withdraw $2,500.00 from her retirement account at the end of each quarter for the next 20 years. If the money in the retirement account earns 6%...
-
nts Ons Let A (10,-24,101,43,-72), B = (-24,43,-99,53,10), and C (10,101,-72,53). Find the following sets: AUB -24, 43, -99, 53, 10, 101, -72 } An B 10, -24,43 (AUC) B={10, -24, 101, 43, -72, 53 An...
-
Each seed of the cotton plant has over 10,000 hair-like fibers that are about 3 cm long. These fibers help the seed get dispersed by the wind. If a seed is launched by the wind at 5 m/s , and it...
-
Harvey is the sole proprietor of a flower shop. From January 1 to June 30, he drove his van 20,000 miles during the year. 16,000 miles were for delivering flowers to customers and 4,000 miles were...
-
Working as a financial analyst at a large automobile corporation that occasionally makes acquisitions of smaller companies that specialize in the production and assembly of small component parts. In...
-
What kind of rays are X-rays?
-
Each day, a weather forecaster predicts whether or not it will rain. For 80% of rainy days, she correctly predicts that it will rain. For 90% of non-rainy days, she correctly predicts that it will...
-
An experiment was performed to determine whether the annealing temperature of ductile iron affects its tensile strength. Five specimens were annealed at each of four temperatures. The tensile...
-
The compressive strength, in kilopascals, was measured for concrete blocks from five different batches of concrete, both three and six days after pouring. The data are presented in the following...
-
Example In January 2004, a Mars Exploration Rover touched down on the surface of Mars and rolled out for exploration ( Figure
-
A battery-operated wall clock no longer keeps timeneither hand moves. Develop a hypothesis explaining why it fails to work, and then make a prediction that permits you to test your hypothesis....
-
Does the snowflake have rotational symmetry in Figure 1.6? If yes, describe the ways in which the flake can be rotated without changing its appearance. Does it have reflection symmetry? If yes,...

Study smarter with the SolutionInn App