

Question: With the data set OSCR.XLS calculate the mean, median, standard deviation, variance, and range using Excel on its own tab. The functions to use are
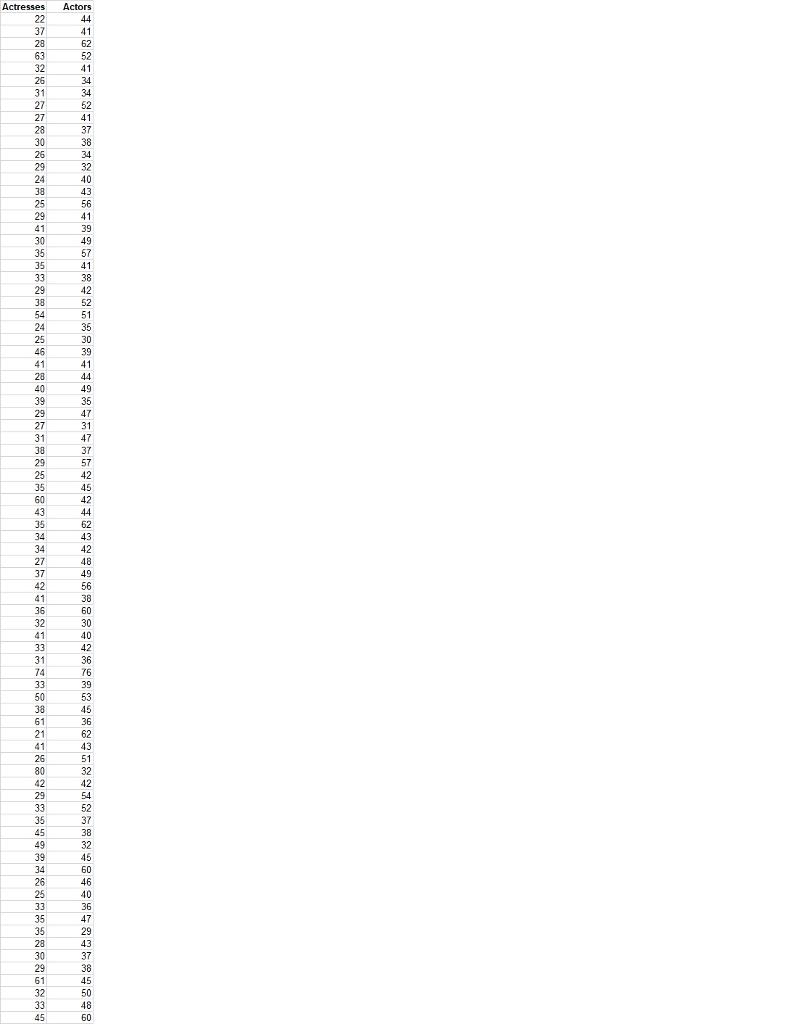
With the data set OSCR.XLS calculate the mean, median, standard deviation, variance, and range using Excel on its own tab. The functions to use are AVERAGE, MEDIAN, STDEV.P, VAR.P, (range = MAX – MIN) for this problem.
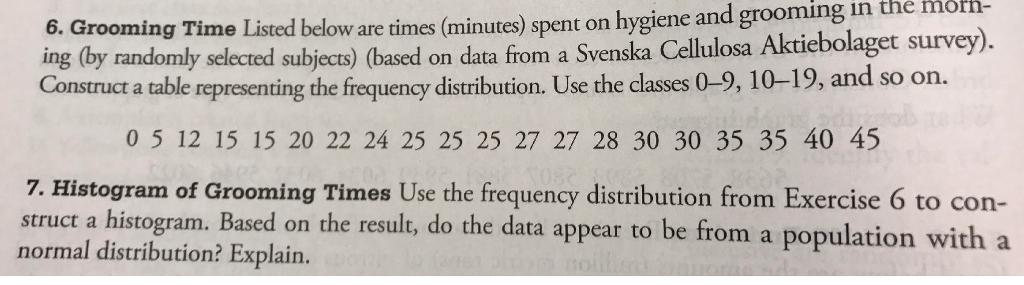
6. Grooming Time Listed below are times (minutes) spent on hygiene and grooming in the morn- ing (by randomly selected subjects) (based on data from a Svenska Cellulosa Aktiebolaget survey). Construct a table representing the frequency distribution. Use the classes 0-9, 10-19, and so on. 0 5 12 15 15 20 22 24 25 25 25 27 27 28 30 30 35 35 40 45 ediye 200 7. Histogram of Grooming Times Use the frequency distribution from Exercise 6 to con- struct a histogram. Based on the result, do the data appear to be from a population with a normal distribution? Explain. oman ty pluon noilled
Step by Step Solution
3.33 Rating (165 Votes )
There are 3 Steps involved in it

Get step-by-step solutions from verified subject matter experts