

Question: In an Excel file, plot the risk (portfolio standard deviation) - expected return of the portfolio from two stocks from Examples 1 and 2 (refer
In an Excel file, plot the risk (portfolio standard deviation) - expected return of the portfolio from two stocks from Examples 1 and 2 (refer to the image below) such that:
1. The risk goes to the horizontal axis
2. The weight alpha of stock 1 should vary from 0 to 1, with increment of 0.05, to yield 20 point plot
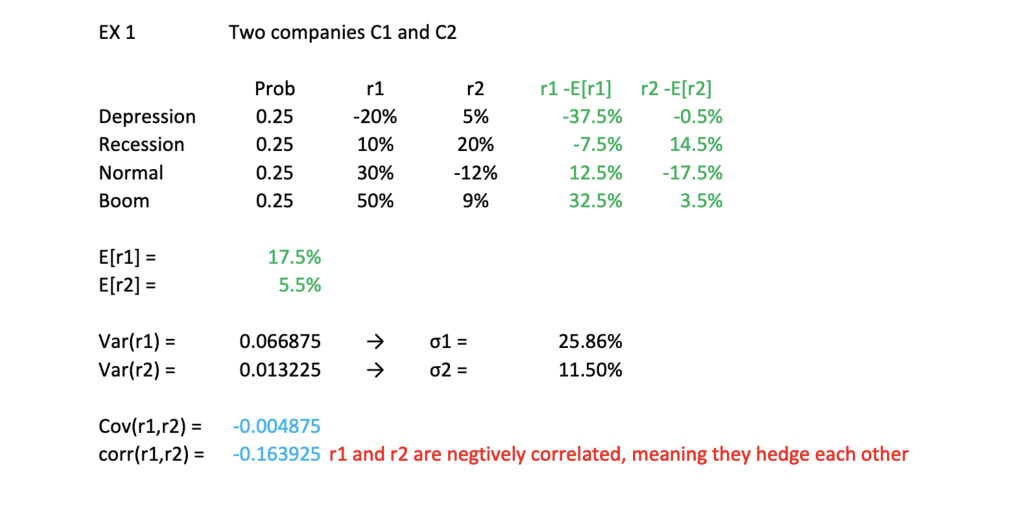
EX 1 Two companies C1 and C2 Depression Recession Normal Boom Prob 0.25 0.25 0.25 0.25 r1 -20% 10% 30% 50% 5% 20% -12% 9% -37.5% -7.5% 12.5% 32.5% -0.5% 14.5% -17.5% 3.5% 17.5% 5.5% E[r2]- Var(r1)- Var(r2)- 0.066875-) i 0.013225-) 2- 25.86% 11.50% Cov(r1,r2)0.004875 corr(r1,r2)0.163925 r1 and r2 are negtively correlated, meaning they hedge each other EX 1 Two companies C1 and C2 Depression Recession Normal Boom Prob 0.25 0.25 0.25 0.25 r1 -20% 10% 30% 50% 5% 20% -12% 9% -37.5% -7.5% 12.5% 32.5% -0.5% 14.5% -17.5% 3.5% 17.5% 5.5% E[r2]- Var(r1)- Var(r2)- 0.066875-) i 0.013225-) 2- 25.86% 11.50% Cov(r1,r2)0.004875 corr(r1,r2)0.163925 r1 and r2 are negtively correlated, meaning they hedge each other
Step by Step Solution
There are 3 Steps involved in it

Get step-by-step solutions from verified subject matter experts