

Question: In an experiment, a variable net force is applied to an object. A graph of the net force exerted on the object as a function
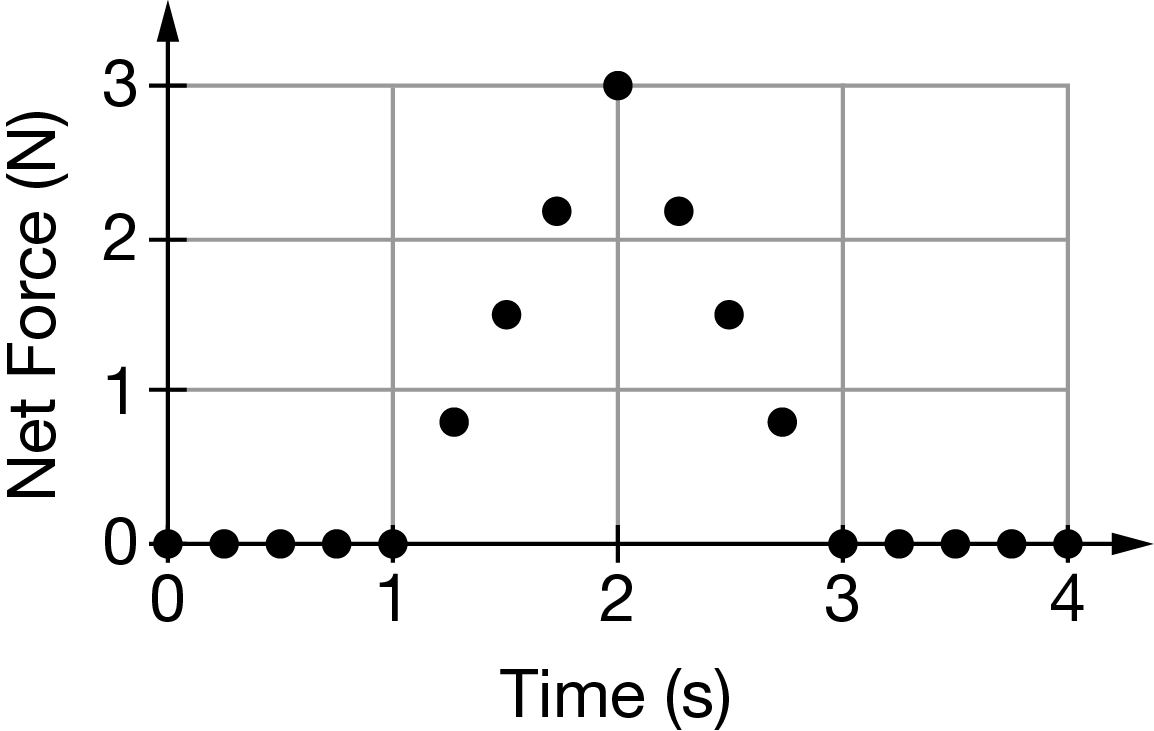
In an experiment, a variable net force is applied to an object. A graph of the net force exerted on the object as a function of time is shown. Which of the following experiments could have been conducted to represent the variable net force shown in the graph?
a) A 0.2kg object increases its speed from 2m/s to 8m/s.
b) A 1kg object increases its speed from 2m/s to 4m/s.
c) A 2kg object increases its speed from 1m/s to 3m/s.
Step by Step Solution
There are 3 Steps involved in it
1 Expert Approved Answer
Step: 1 Unlock

Question Has Been Solved by an Expert!
Get step-by-step solutions from verified subject matter experts
Step: 2 Unlock
Step: 3 Unlock