

Question: In an experiment a vertical spring was fixed at its upper end. It was stretched by hanging different weights on its lower end. The length
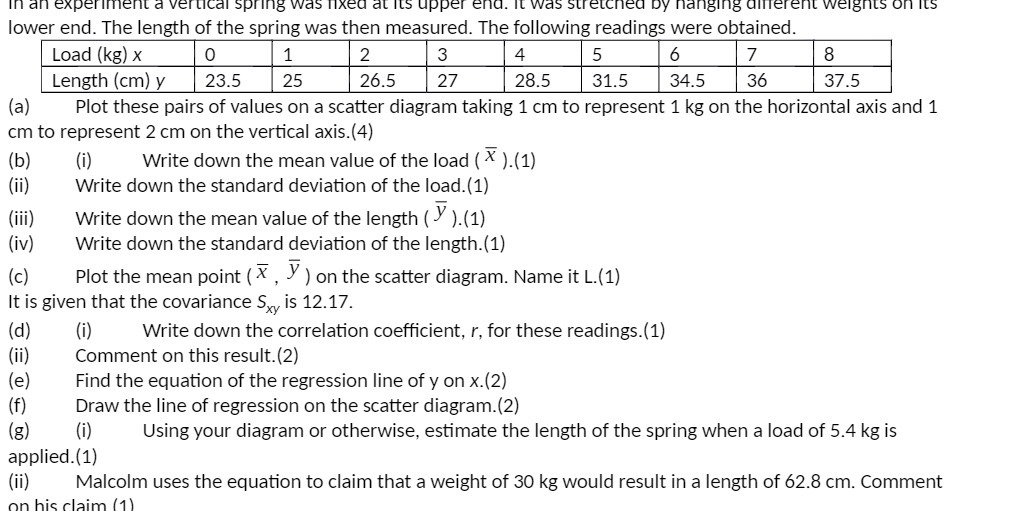
In an experiment a vertical spring was fixed at its upper end. It was stretched by hanging different weights on its lower end. The length of the spring was then measured. The following readings were obtained. Load (kg) x 0 1 2 3 4 5 6 7 8 Length (cm) y 23.5 25 26.5 27 28.5 31.5 34.5 36 37.5 (a) Plot these pairs of values on a scatter diagram taking 1 cm to represent 1 kg on the horizontal axis and 1 cm to represent 2 cm on the vertical axis.(4) (b) (i) Write down the mean value of the load ( X ).(1) (ii) Write down the standard deviation of the load.(1) (iii) Write down the mean value of the length ( ) ).(1) (iv) Write down the standard deviation of the length.(1) Plot the mean point ( X , ) ) on the scatter diagram. Name it L.(1) It is given that the covariance S, is 12.17. (d) (i) Write down the correlation coefficient, r, for these readings.(1) (ii) E Comment on this result.(2) (e) Find the equation of the regression line of y on x.(2) (f) Draw the line of regression on the scatter diagram.(2) (g) (i) Using your diagram or otherwise, estimate the length of the spring when a load of 5.4 kg is applied.(1) (ii) Malcolm uses the equation to claim that a weight of 30 kg would result in a length of 62.8 cm. Comment on his claim (1)
Step by Step Solution
There are 3 Steps involved in it

Get step-by-step solutions from verified subject matter experts