

Question: In Assignment 3, I need help to create a high-level activity list based on the WBS that I completed in Assignment 2 which I attached.
In Assignment 3, I need help to create a high-level activity list based on the WBS that I completed in Assignment 2 which I attached. I also need help making a Project Schedule Network Diagram from the activity list using Word or Excel. Finally, I need help with creating a Gantt Chart Schedule in Word or Excel based on the information that I attached. Assignment 3 is not the complete schedule because the WBS did not decompose the work to the work package level. As project manager, your goal is to provide the big-picture relationship between the activities. Use the template provided and follow the more detailed instructions. I attached the notes and templates from the course that I am taking PRM: 524 Applied Project Management Case
| Instructions |
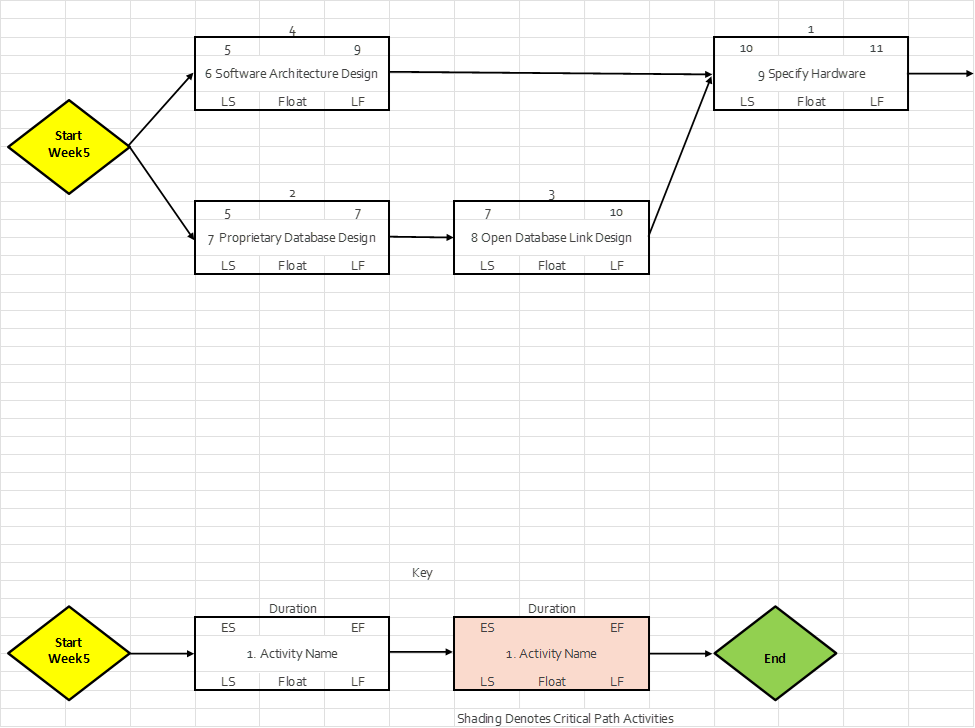
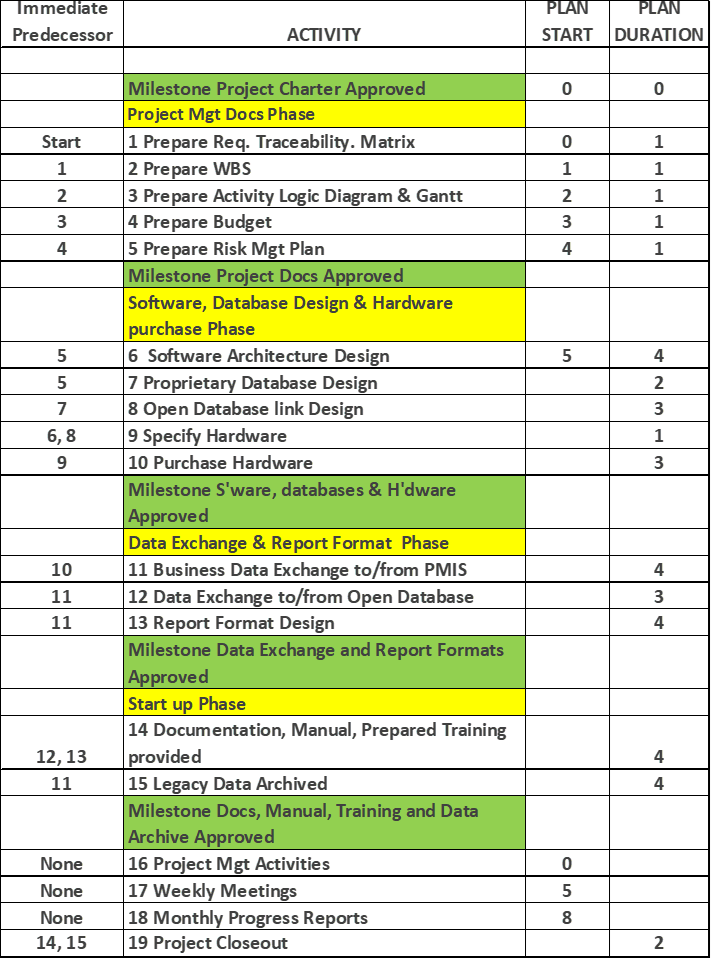
| Activity Logic |
| This is an information page. It provides the immediate predecessor to activities. |
| Use this information to develop the logic diagram |
| Use the PMI methodology such as starting at week 0 and the week number of the successor is identical to the end week of the immediate predecessor. |
| Logic Diagram has been started for you. |
| 1. You can continue to use this spreadsheet, just copy and paste the activity boxes according to the logic. Option is to do it another way. |
| 2. Perform the forward pass through the network to determine the early start and early finish of each activity |
| 3. Perform the backward pass through the network to determine the late start and late finish of each activity |
| 4. Calculate the float for activities not on the critical path. |
| 5. Use your calculated start and finish dates to complete the Gantt Schedule on the |
| 6. You don't need add the completed work on the project management plan in the logic diagram. The work is completed. |
| 7. The calculated early start and early finish are correct for the activities shown. |
| 8. Feel free to change the column widths to fit the diagram onto one page. |
| 9. Make a screen shot of your logic diagram to submit as part of the project plan. |
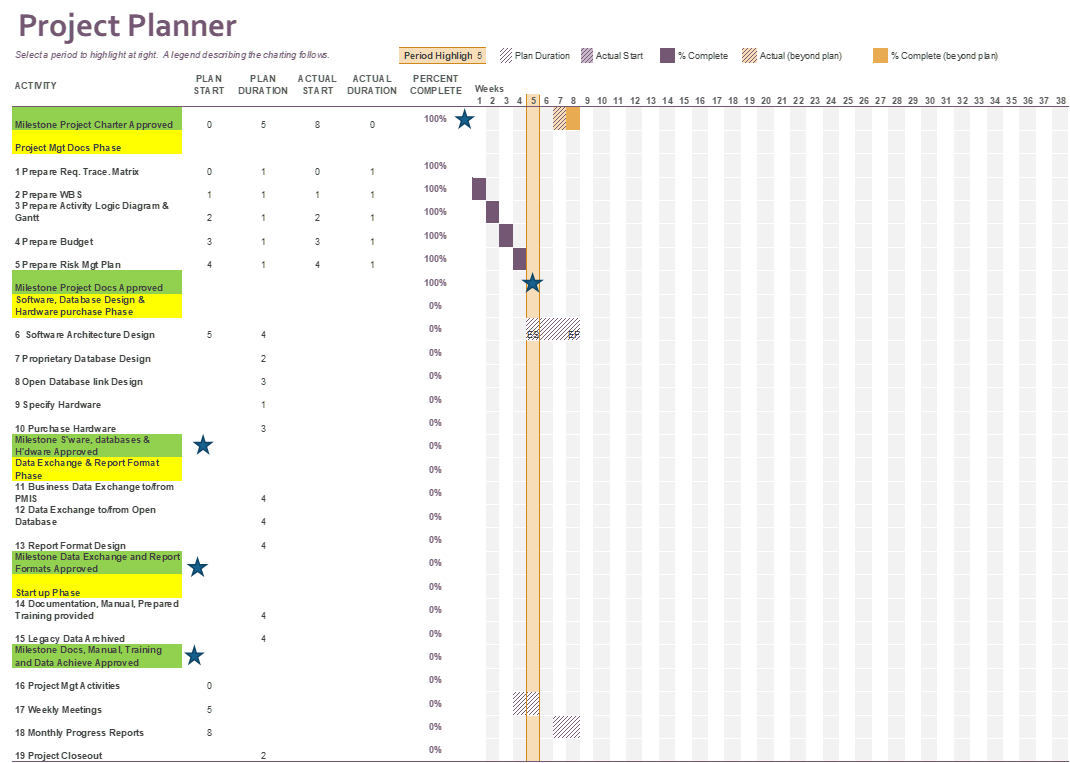
| Gantt Chart Schedule |
| 1. The activity number and activity description are given. |
| 2. Use the Early Start and Early Finish for the bars on the critical path activities |
| 3. Use the Early Start and Late Finish for activities not on the critical path |
| 4. For the project management activities, use the start date given and end at the end of the project. |
| 5. The monthly progress reports will be completed on four week intervals beginning with the start date given. |
| 6. Move the Milestone Stars in the week in which you achieve the milestone. |
| 7. Make a screen shot of your Gantt Chart Schedule to submit as part of the project plan. |
Step by Step Solution
There are 3 Steps involved in it

Get step-by-step solutions from verified subject matter experts