

Question: In Bloomberg, go to the GC function and graph the yield curves for the following classes of bonds: 1. U.S. Treasuries - Curve I25 2.
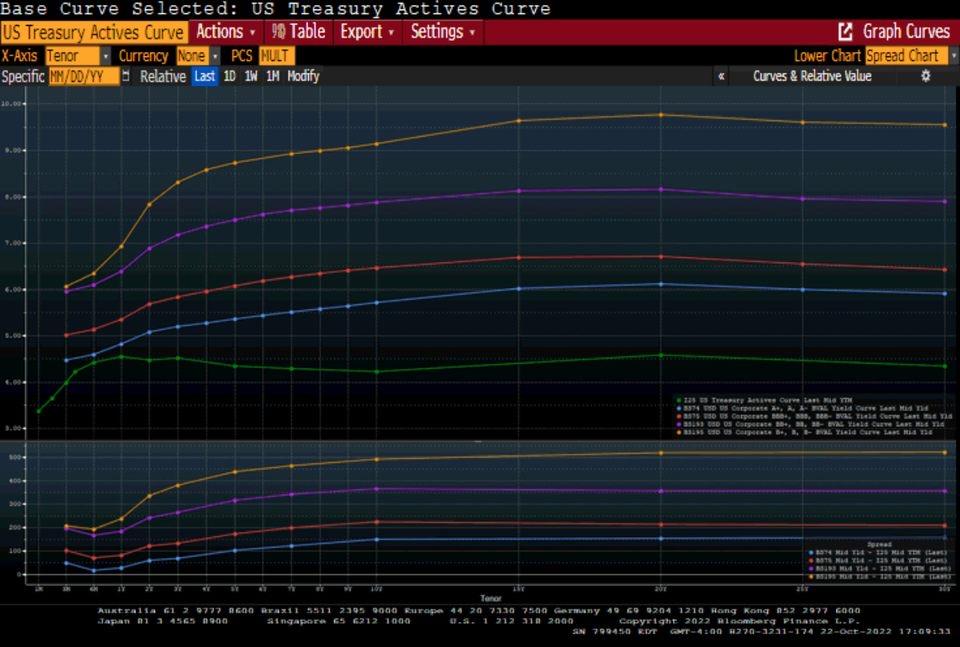
In Bloomberg, go to the GC function and graph the yield curves for the following classes of bonds:
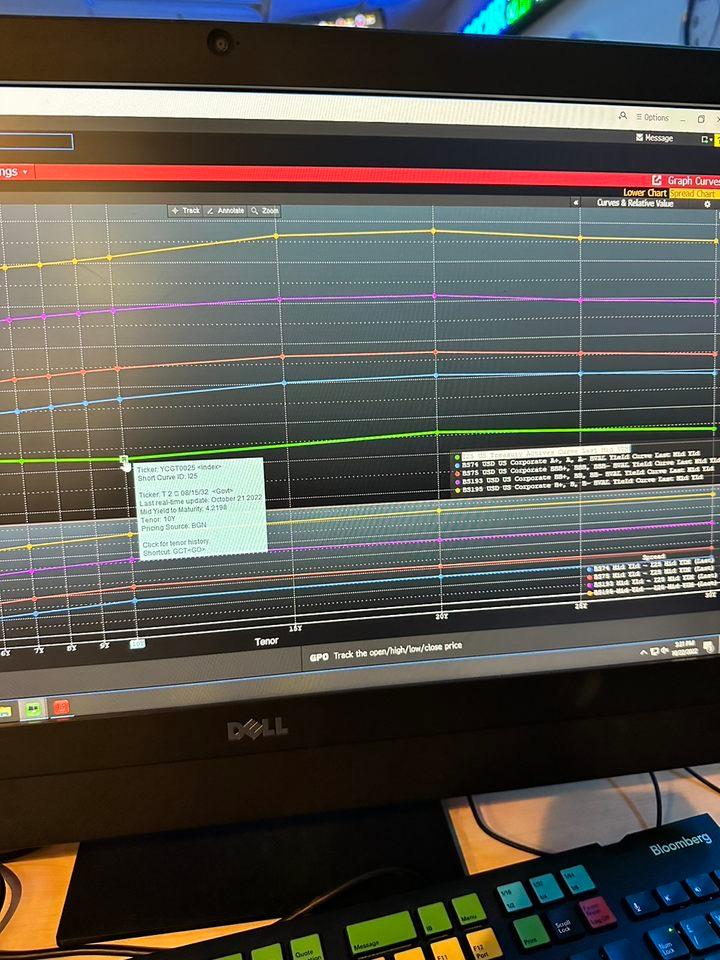
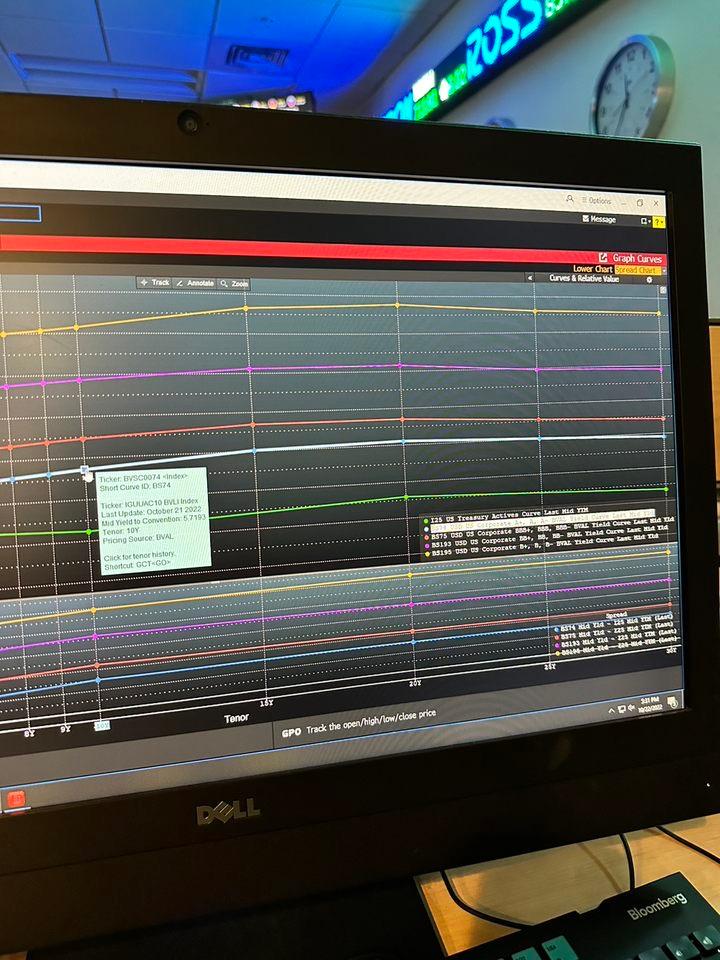
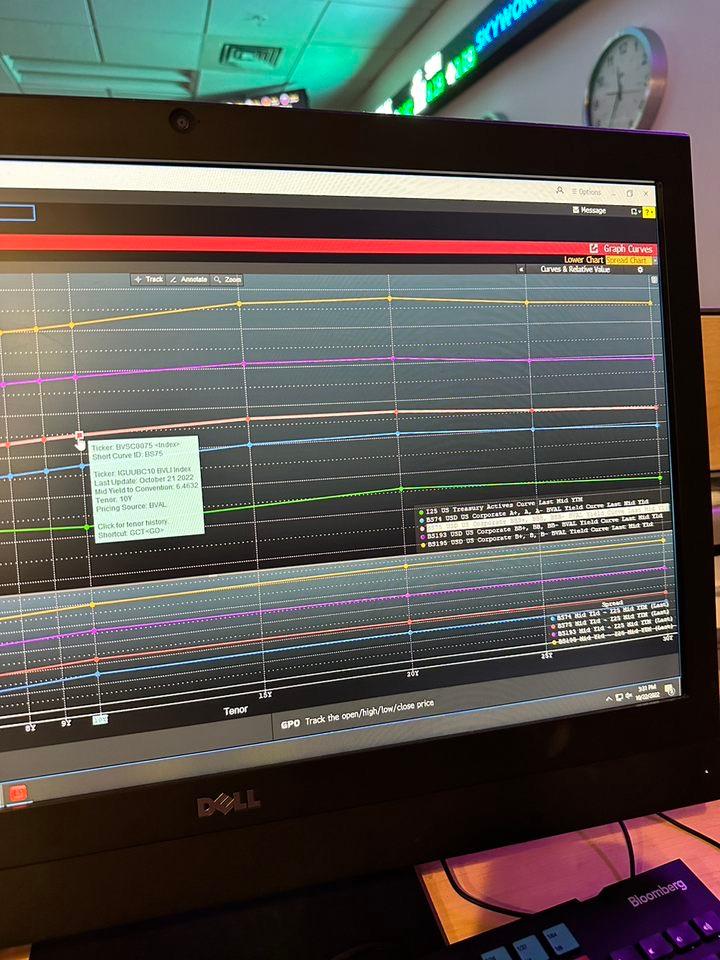
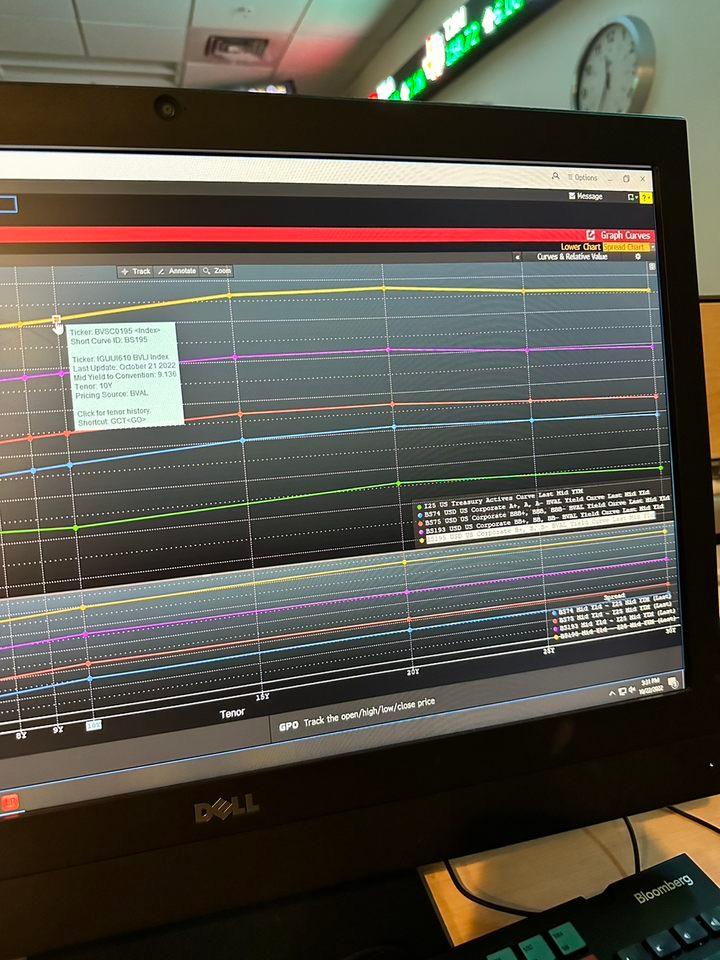
1. U.S. Treasuries - Curve I25
2. U.S. Corporate bonds with A credit rating - Curve BS74
3. U.S. Corporate bonds with BBB credit rating - Curve BS75
4. U.S. Corporate bonds with BB credit rating - Curve BS193
5. U.S. Corporate bonds with B credit rating - Curve BS195
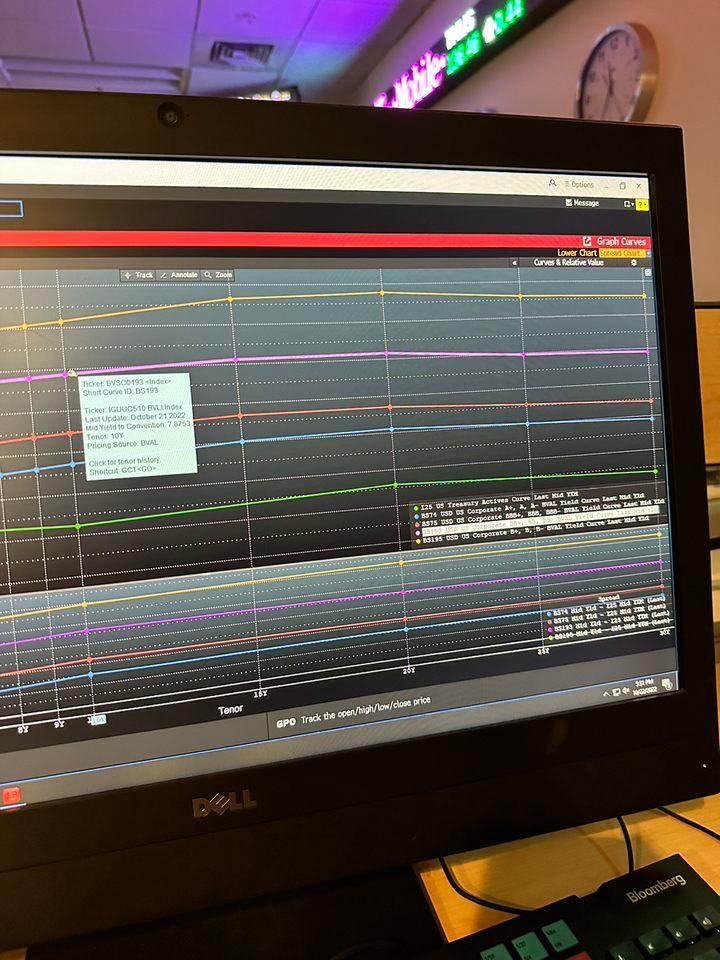
the pictures attached are screenshots of the graphs
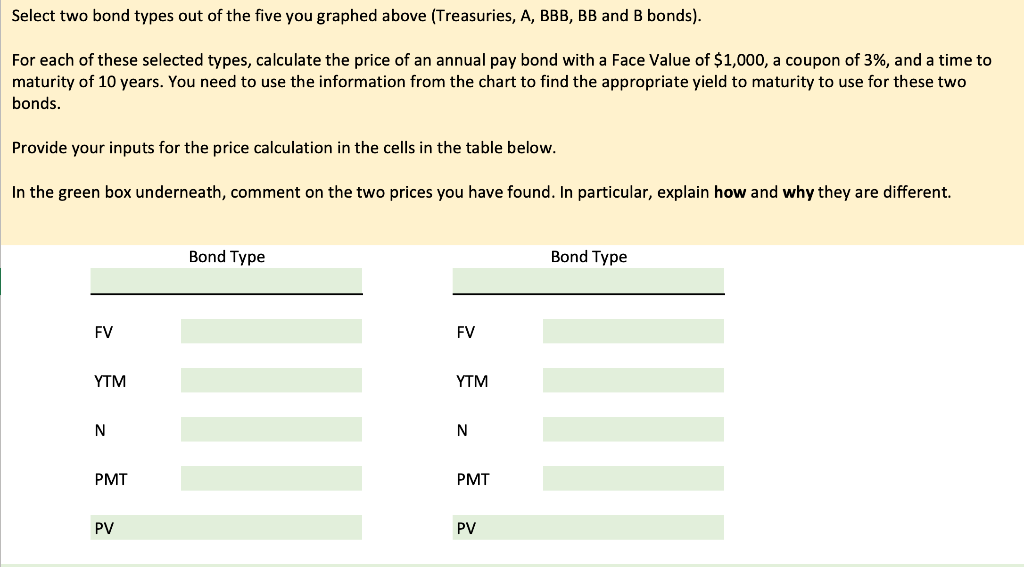
Select two bond types out of the five you graphed above (Treasuries, A, BBB, BB and B bonds). For each of these selected types, calculate the price of an annual pay bond with a Face Value of $1,000, a coupon of 3%, and a time to maturity of 10 years. You need to use the information from the chart to find the appropriate yield to maturity to use for these two bonds. Provide your inputs for the price calculation in the cells in the table below. In the green box underneath, comment on the two prices you have found. In particular, explain how and why they are different. Select two bond types out of the five you graphed above (Treasuries, A, BBB, BB and B bonds). For each of these selected types, calculate the price of an annual pay bond with a Face Value of $1,000, a coupon of 3%, and a time to maturity of 10 years. You need to use the information from the chart to find the appropriate yield to maturity to use for these two bonds. Provide your inputs for the price calculation in the cells in the table below. In the green box underneath, comment on the two prices you have found. In particular, explain how and why they are different
Step by Step Solution
There are 3 Steps involved in it

Get step-by-step solutions from verified subject matter experts