

Question: In calculating for Sensitivity Analysis, what are the formula(s)/how do I calculate for the Pessimistic and Optimistic: -Operating Income -Contribution Margin Ratio -Profit margin -Breakeven
In calculating for Sensitivity Analysis, what are the formula(s)/how do I calculate for the Pessimistic and Optimistic:
-Operating Income -Contribution Margin Ratio -Profit margin -Breakeven Sales (in units) -Margin of Safety (in Units) -Margin of Ratio
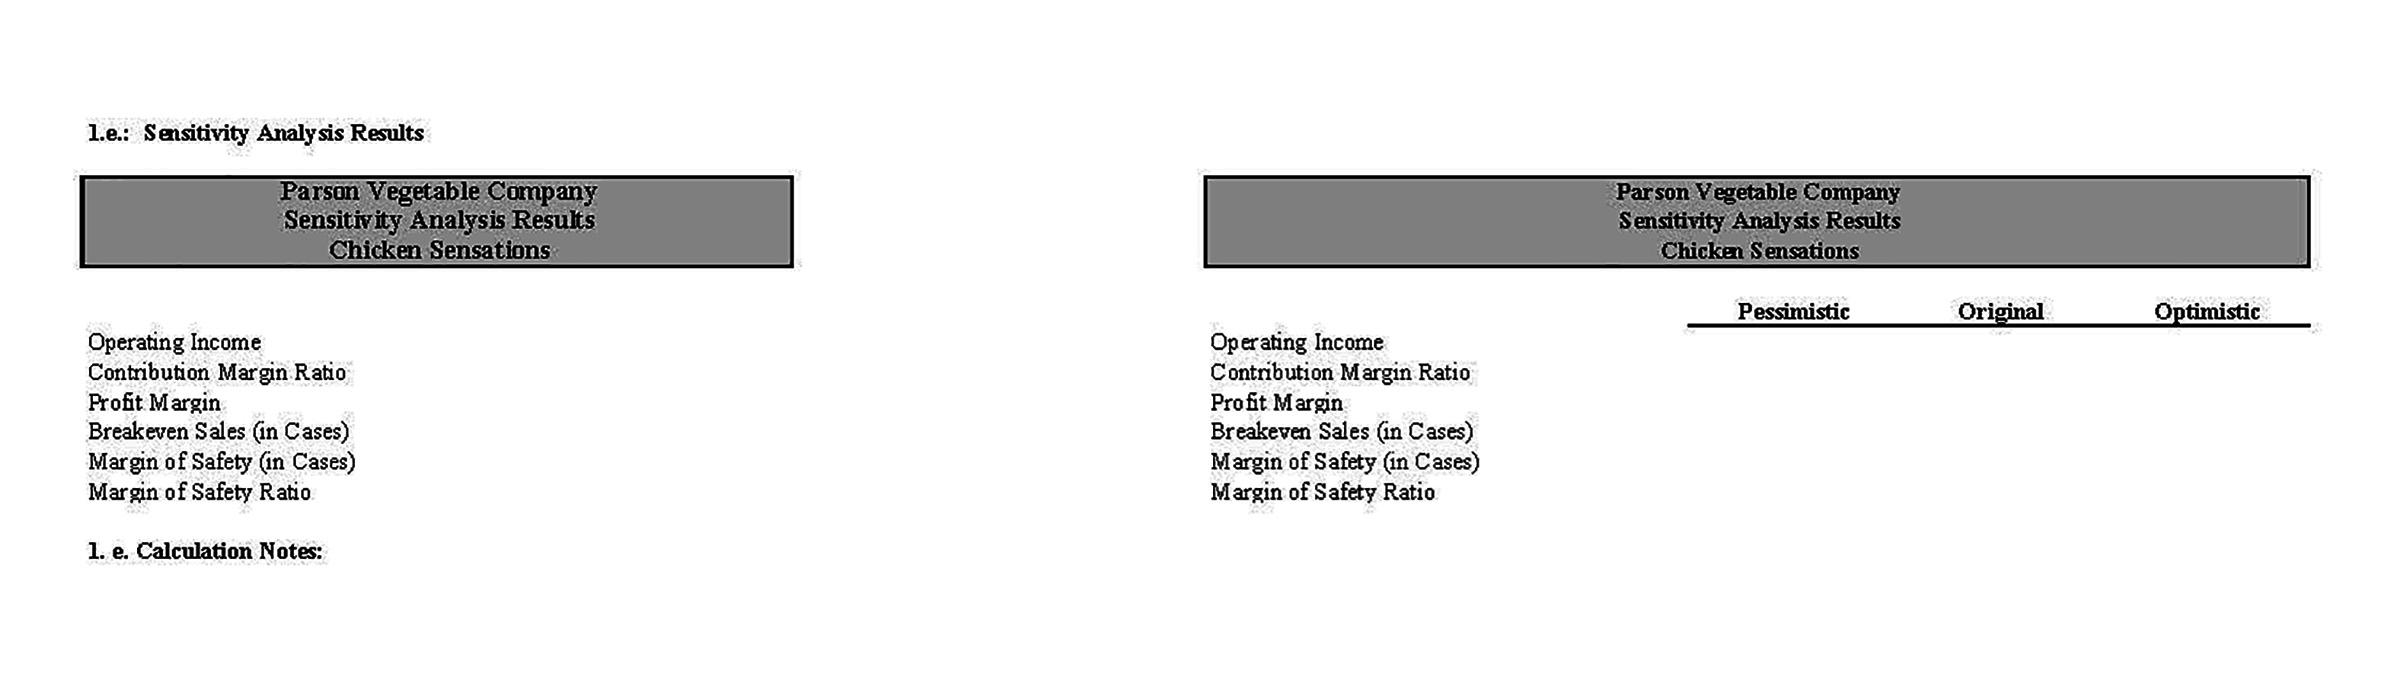
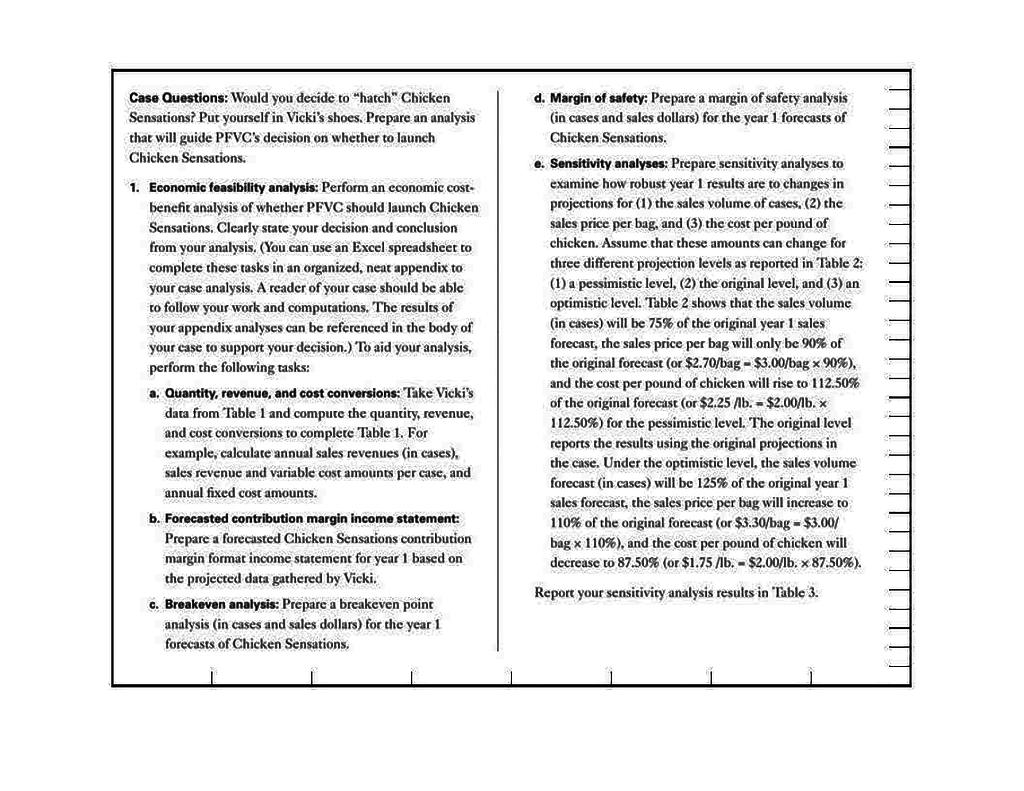
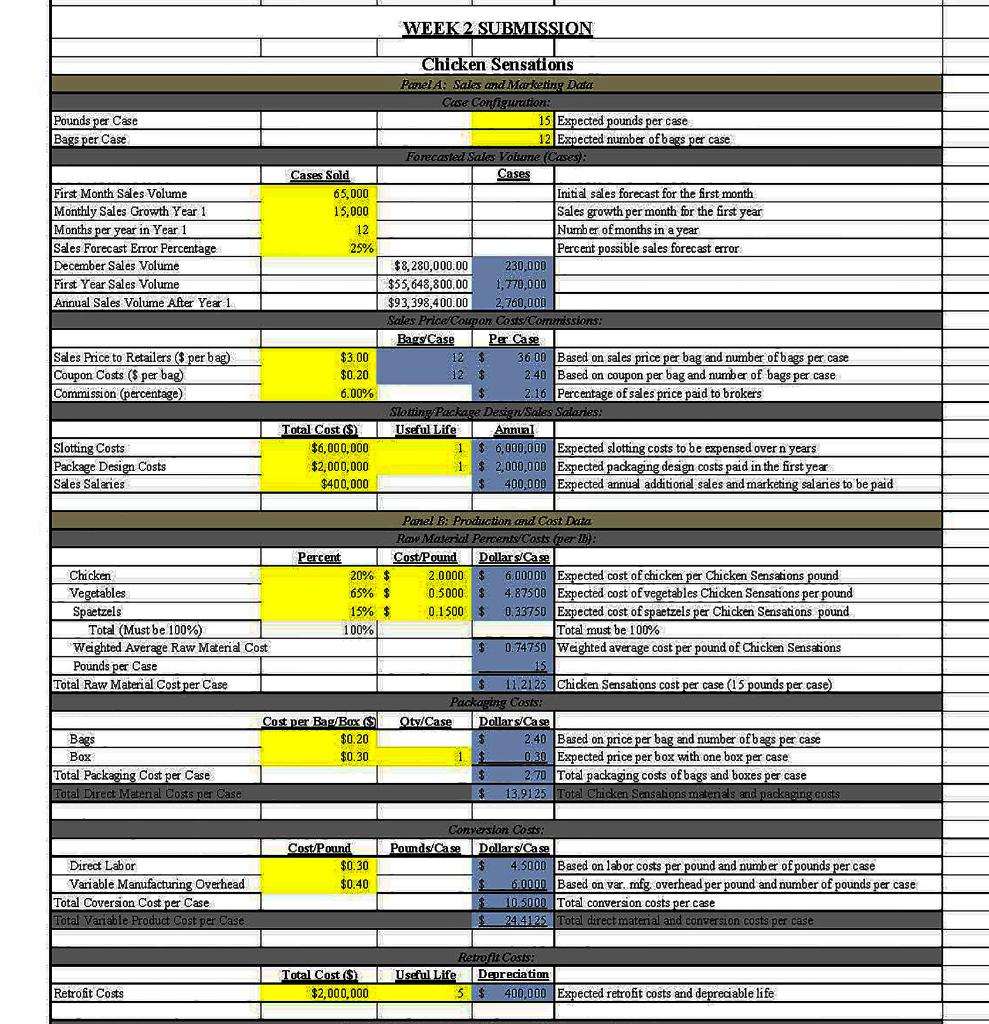
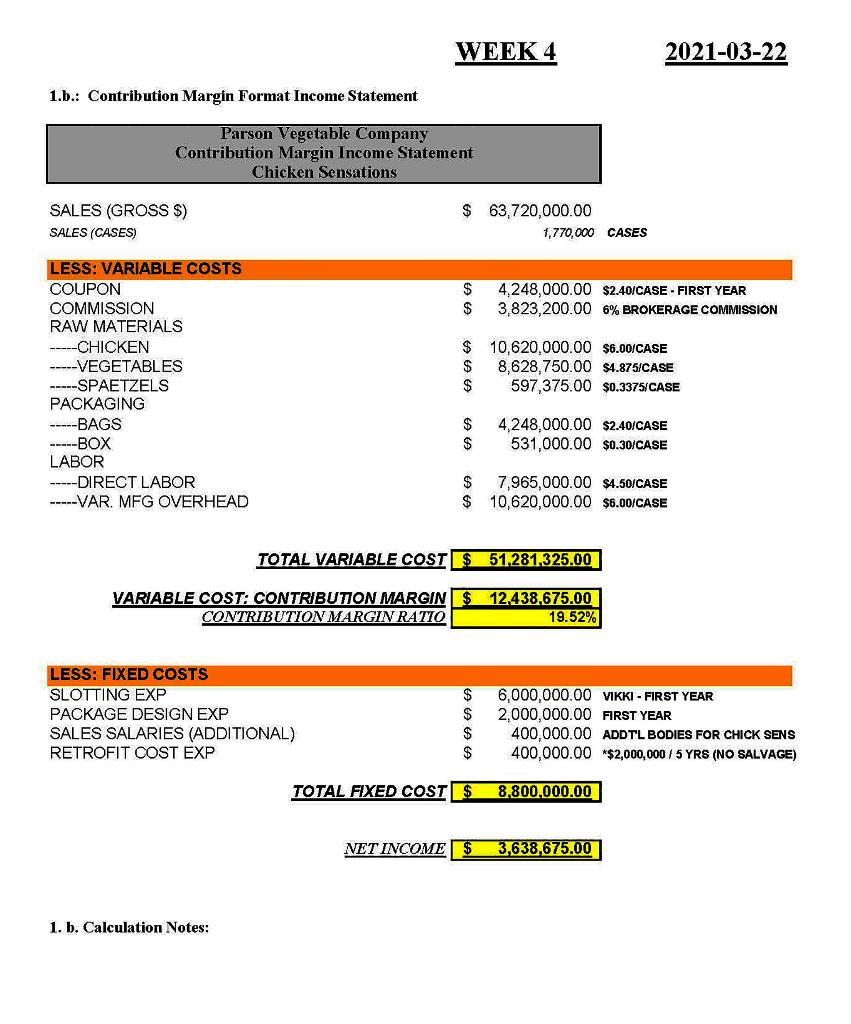
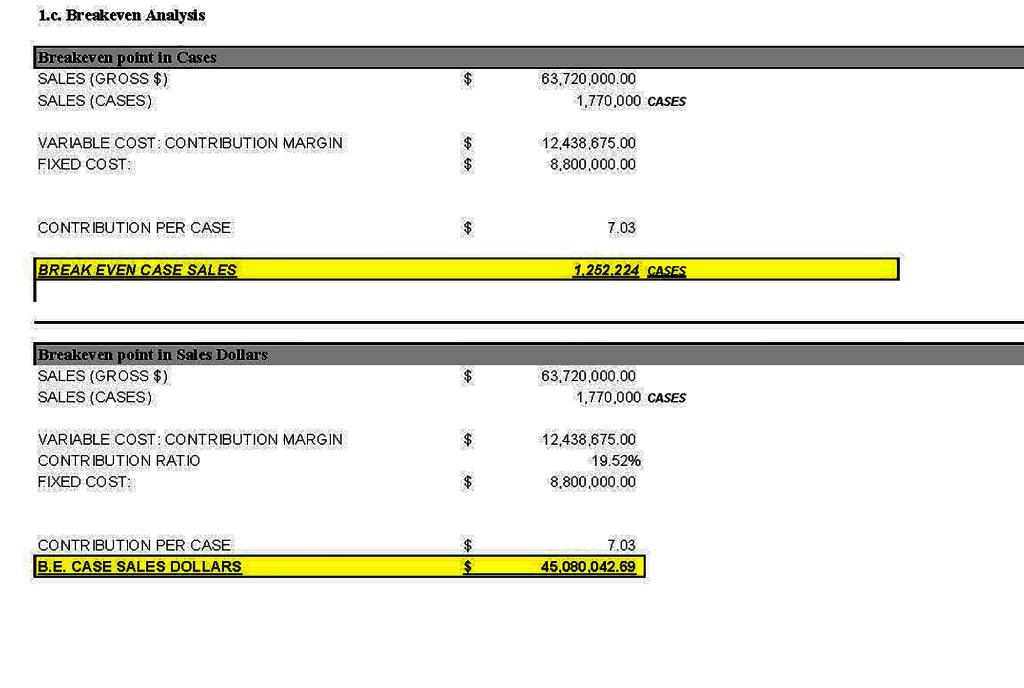
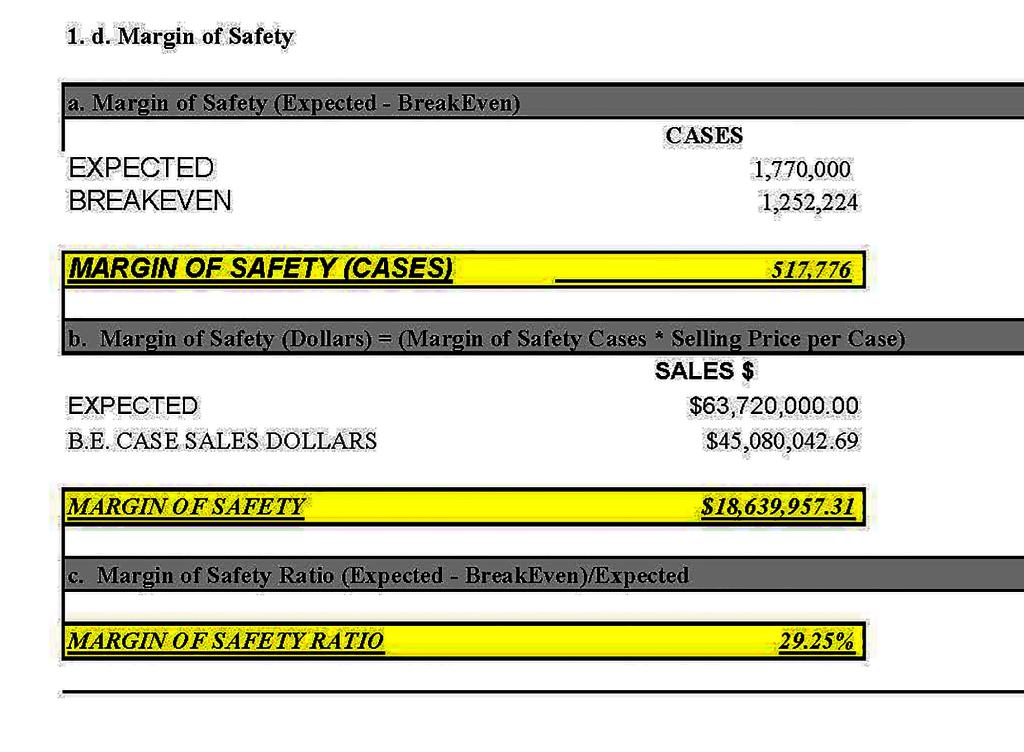
1.e.: Sensitivity Analysis Results Parson Vegetable Company Sensitivity Analysis Results Chicken Sensations Parson Vegetable Company Sensitivity Analysis Results Chicken Sensations Pessimistic Original Optimistic Operating Income Contribution Margin Ratio Profit Margin Breakeven Sales (in Cases) Margin of Safety (in Cases) Margin of Safety Ratio Operating Income Contribution Margin Ratio Profit Margin Breakeven Sales (in Cases) Margin of Safety (in Cases) Margin of Safety Ratio 1. e. Calculation Notes: Case Questions: Would you decide to Whatch" Chicken Sensations? Put yourself in Vicki's shoes. Prepare an analysis that will guide PFVC's decision on whether to launch Chicken Sensations. 1. Economic feasibility analysis: Perform an economic cost- benefit analysis of whether PFVC should launch Chicken Sensations. Clearly state your decision and conclusion from your analysis. (You can use an Excel spreadsheet to complete these tasks in an organized, neat appendix to your case analysis. A reader of your case should be able to follow your work and computations. The results of your appendix analyses can be referenced in the body of your case to support your decision.) To aid your analysis, perform the following tasks: a. Quantity, revenue, and cost conversions: Take Vicki's data from Table I and compute the quantity, revenue, and cost conversions to complete Table 1. For example, calculate annual sales revenues (in cases), sales revenue and variable cost amounts per case, and annual fixed cost amounts. b. Forecasted contribution margin income statement: Prepare a forecasted Chicken Sensations contribution margin format income statement for year 1 based on the projected data gathered by Vicki. c. Breakeven analysis: Prepare a breakeven point analysis (in cases and sales dollars) for the year 1 forecasts of Chicken Sensations, d. Margin of safety: Prepare a margin of safety analysis (in cases and sales dollars) for the year 1 forecasts of Chicken Sensations. e. Sensitivity analyses: Prepare sensitivity analyses to examine how robust year I results are to changes in projections for (1) the sales volume of cases, (2) the sales price per bag, and (3) the cost per pound of chicken. Assume that these amounts can change for three different projection levels as reported in Table 2: (1) a pessimistic level, (2) the original level, and (3) an optimistic level. Table 2 shows that the sales volume (in cases) will be 75% of the original year 1 sales forecast, the sales price per bag will only be 90% of the original forecast (or $2.70/bag - $3.00/bag x 90%), and the cost per pound of chicken will rise to 112.50% of the original forecast (or $2.25 /b. = $2.00/lb. x 112.50%) for the pessimistic level. The original level reports the results using the original projections in the case. Under the optimistic level, the sales volum forecast (in cases) will be 125% of the original year 1 sales forecast, the sales price per bag will increase to 110% of the original forecast (or $3.30/bag - $3.00/ bag x 110%), and the cost per pound of chicken will decrease to 87.50% (or $1.75 /ib. - $2.00/1b. x 87.50%). Report your sensitivity analysis results in "Table 3. WEEK 2 SUBMISSION Pounds per Case Bags per Case First Month Sales Volume Monthly Sales Growth Year 1 Months per year in Year 1 Sales Forecast Error Percentage December Sales Volume First Year Sales Volume Annual Sales Volume After Year 1 Cases Sold 65,000 15,000 12 25% Chicken Sensations Panel A: Sales and Marketing Data Case Configuration: 15 Expected pounds per case 12 Expected number of bags per case Forecasted Sales Volume (Cases): Cases Initial sales forecast for the first month Sales growth per month for the first year Number of months in a year Percent possible sales forecast error $8,280,000.00 230,000 $55,648,800.00 1,770,000 $93,398,400.00 2,760,000 Sales Price Coupon Costs/Corrudssions: Bags/Case Per Case 12 $ 36 00 Based on sales price per bag and number of bags per case 12 $ 2.40 Based on coupon per bag and number of bags per case $ 2.16 Percentage of sales price paid to brokers Slotting Package Design/Sales Salaries: Useful Life Annual 1 $ 6,000,000 Expected slotting costs to be expensed over n years 1$ 2,000,000 Expected packaging design costs paid in the first year $ 400.000 Expected annual additional sales and marketing salaries to be paid Sales Price to Retailers ($ per bag) Coupon Costs ($ per bag) Commission (percentage) $3.00 $0.20 6.00% Slotting Costs Package Design Costs Sales Salaries Total Cost (5) $6,000,000 $2,000,000 $400,000 Panel B: Production and Cost Data Rep Material Percents Costs (per IB): Percent Cost/Pound Dollars/Case Chicken 20% $ 2.0000 $ 6,00000 Expected cost of chicken per Chicken Sensations pound Vegetables 65% $ 0 5000 $ 4,87500 Expected cost of vegetables Chicken Sensations per pound Spaetzels 15% $ 0.1500 $ 0.33750 Expected cost of spaetzels per Chicken Sensations pound Total (Must be 100%) 100% Total must be 100% Weighted Average Raw Material Cost $ 0.74750 Weighted average cost per pound of Chicken Sensations Pounds per Case 15 Total Raw Material Cost per Case $ 11.2125 Chicken Sensations cost per case (15 pounds per case) Packaging Costs: Cost per Bag/Bax ($ Oty/Case Dollars/Case Bags $0.20 2,40 Based on price per bag and number of bags per case Box $0.30 1 0.30 Expected price per box with one box per case Total Packaging Cost per Case $ 2,70 Total packaging costs of bags and boxes per case Total Direct Matenal Costs per Case 13.9125 Total Chicken Sensations matends and packaging costs Cost/Pound $0.30 $0.40 Direct Labor Variable Manufacturing Overhead Total Coversion Cost per Case Total Variable Product Cost per Case Conversion Costs: Poids/Case Dollars/Case 4.5000 Based on labor costs per pound and number of pounds per case 6.0000 Based on var. mfg overhead per pound and number of pounds per case 10.5000 Total conversion costs per case 244125 Total direct material and conversion costs per case Total Cost $ $2,000,000 Retrofit Costs: Useful Life Depreciation 5 $ 400,000 Expected retrofit costs and depreciable life Retrofit Costs WEEK 4 2021-03-22 1.b.: Contribution Margin Format Income Statement Parson Vegetable Company Contribution Margin Income Statement Chicken Sensations SALES (GROSS $) SALES (CASES) $ 63,720,000.00 1,770,000 CASES $ $ 4,248,000.00 $2.40/CASE - FIRST YEAR 3,823,200.00 6% BROKERAGE COMMISSION LESS: VARIABLE COSTS COUPON COMMISSION RAW MATERIALS -----CHICKEN -----VEGETABLES -----SPAETZELS PACKAGING -----BAGS -----BOX LABOR -----DIRECT LABOR -----VAR. MFG OVERHEAD $ 10,620,000.00 $6.00/CASE $ 8,628,750.00 $4.875/CASE $ 597,375.00 $0.3375/CASE $ $ 4,248,000.00 $2.40/CASE 531,000.00 $0.30/CASE $ 7,965,000.00 $4.50/CASE $ 10,620,000.00 $6.00/CASE TOTAL VARIABLE COSTES 51.281.325.00 VARIABLE COST: CONTRIBUTION MARGIN $ 12.438,675.00 CONTRIBUTION MARGIN RATIO 19.52% LESS: FIXED COSTS SLOTTING EXP PACKAGE DESIGN EXP SALES SALARIES (ADDITIONAL) RETROFIT COST EXP $ $ $ $ 6,000,000.00 VIKKI - FIRST YEAR 2,000,000.00 FIRST YEAR 400,000.00 ADDTL BODIES FOR CHICK SENS 400,000.00 $2,000,000 / 5 YRS (NO SALVAGE) TOTAL FIXED COST$ 8.800,000.00 NET INCOME $ 3,638,675.00 1. b. Calculation Notes: 1.c. Breakeven Analysis Breakeven point in Cases SALES (GROSS $) SALES (CASES) $ 63,720,000.00 1,770,000 CASES VARIABLE COST: CONTRIBUTION MARGIN FIXED COST: 12,438,675.00 8,800,000.00 CONTRIBUTION PER CASE $ 7.03 BREAK EVEN CASE SALES 1.252.224 CASES Breakeven point in Sales Dollars SALES (GROSS $) SALES (CASES) 63,720,000.00 1,770,000 CASES $ VARIABLE COST: CONTRIBUTION MARGIN CONTRIBUTION RATIO FIXED COST: 12,438,675.00 19.52% 8,800,000.00 $ CONTRIBUTION PER CASE B.E. CASE SALES DOLLARS 7.03 45.080,042.69 $ 1. d. Margin of Safety a. Margin of Safety (Expected - BreakEven) EXPECTED BREAKEVEN CASES 1,770,000 1,252,224 MARGIN OF SAFETY CASES) 517,776 b. Margin of Safety (Dollars) = (Margin of Safety Cases * Selling Price per Case) SALES $ EXPECTED $63,720,000.00 B.E. CASE SALES DOLLARS $45,080,042.69 MARGIN OF SAFETY $18,639.957.31 C. Margin of Safety Ratio (Expected - BreakEven)/Expected MARGIN OF SAFETY RATIO 29.25% 1.e.: Sensitivity Analysis Results Parson Vegetable Company Sensitivity Analysis Results Chicken Sensations Parson Vegetable Company Sensitivity Analysis Results Chicken Sensations Pessimistic Original Optimistic Operating Income Contribution Margin Ratio Profit Margin Breakeven Sales (in Cases) Margin of Safety (in Cases) Margin of Safety Ratio Operating Income Contribution Margin Ratio Profit Margin Breakeven Sales (in Cases) Margin of Safety (in Cases) Margin of Safety Ratio 1. e. Calculation Notes: Case Questions: Would you decide to Whatch" Chicken Sensations? Put yourself in Vicki's shoes. Prepare an analysis that will guide PFVC's decision on whether to launch Chicken Sensations. 1. Economic feasibility analysis: Perform an economic cost- benefit analysis of whether PFVC should launch Chicken Sensations. Clearly state your decision and conclusion from your analysis. (You can use an Excel spreadsheet to complete these tasks in an organized, neat appendix to your case analysis. A reader of your case should be able to follow your work and computations. The results of your appendix analyses can be referenced in the body of your case to support your decision.) To aid your analysis, perform the following tasks: a. Quantity, revenue, and cost conversions: Take Vicki's data from Table I and compute the quantity, revenue, and cost conversions to complete Table 1. For example, calculate annual sales revenues (in cases), sales revenue and variable cost amounts per case, and annual fixed cost amounts. b. Forecasted contribution margin income statement: Prepare a forecasted Chicken Sensations contribution margin format income statement for year 1 based on the projected data gathered by Vicki. c. Breakeven analysis: Prepare a breakeven point analysis (in cases and sales dollars) for the year 1 forecasts of Chicken Sensations, d. Margin of safety: Prepare a margin of safety analysis (in cases and sales dollars) for the year 1 forecasts of Chicken Sensations. e. Sensitivity analyses: Prepare sensitivity analyses to examine how robust year I results are to changes in projections for (1) the sales volume of cases, (2) the sales price per bag, and (3) the cost per pound of chicken. Assume that these amounts can change for three different projection levels as reported in Table 2: (1) a pessimistic level, (2) the original level, and (3) an optimistic level. Table 2 shows that the sales volume (in cases) will be 75% of the original year 1 sales forecast, the sales price per bag will only be 90% of the original forecast (or $2.70/bag - $3.00/bag x 90%), and the cost per pound of chicken will rise to 112.50% of the original forecast (or $2.25 /b. = $2.00/lb. x 112.50%) for the pessimistic level. The original level reports the results using the original projections in the case. Under the optimistic level, the sales volum forecast (in cases) will be 125% of the original year 1 sales forecast, the sales price per bag will increase to 110% of the original forecast (or $3.30/bag - $3.00/ bag x 110%), and the cost per pound of chicken will decrease to 87.50% (or $1.75 /ib. - $2.00/1b. x 87.50%). Report your sensitivity analysis results in "Table 3. WEEK 2 SUBMISSION Pounds per Case Bags per Case First Month Sales Volume Monthly Sales Growth Year 1 Months per year in Year 1 Sales Forecast Error Percentage December Sales Volume First Year Sales Volume Annual Sales Volume After Year 1 Cases Sold 65,000 15,000 12 25% Chicken Sensations Panel A: Sales and Marketing Data Case Configuration: 15 Expected pounds per case 12 Expected number of bags per case Forecasted Sales Volume (Cases): Cases Initial sales forecast for the first month Sales growth per month for the first year Number of months in a year Percent possible sales forecast error $8,280,000.00 230,000 $55,648,800.00 1,770,000 $93,398,400.00 2,760,000 Sales Price Coupon Costs/Corrudssions: Bags/Case Per Case 12 $ 36 00 Based on sales price per bag and number of bags per case 12 $ 2.40 Based on coupon per bag and number of bags per case $ 2.16 Percentage of sales price paid to brokers Slotting Package Design/Sales Salaries: Useful Life Annual 1 $ 6,000,000 Expected slotting costs to be expensed over n years 1$ 2,000,000 Expected packaging design costs paid in the first year $ 400.000 Expected annual additional sales and marketing salaries to be paid Sales Price to Retailers ($ per bag) Coupon Costs ($ per bag) Commission (percentage) $3.00 $0.20 6.00% Slotting Costs Package Design Costs Sales Salaries Total Cost (5) $6,000,000 $2,000,000 $400,000 Panel B: Production and Cost Data Rep Material Percents Costs (per IB): Percent Cost/Pound Dollars/Case Chicken 20% $ 2.0000 $ 6,00000 Expected cost of chicken per Chicken Sensations pound Vegetables 65% $ 0 5000 $ 4,87500 Expected cost of vegetables Chicken Sensations per pound Spaetzels 15% $ 0.1500 $ 0.33750 Expected cost of spaetzels per Chicken Sensations pound Total (Must be 100%) 100% Total must be 100% Weighted Average Raw Material Cost $ 0.74750 Weighted average cost per pound of Chicken Sensations Pounds per Case 15 Total Raw Material Cost per Case $ 11.2125 Chicken Sensations cost per case (15 pounds per case) Packaging Costs: Cost per Bag/Bax ($ Oty/Case Dollars/Case Bags $0.20 2,40 Based on price per bag and number of bags per case Box $0.30 1 0.30 Expected price per box with one box per case Total Packaging Cost per Case $ 2,70 Total packaging costs of bags and boxes per case Total Direct Matenal Costs per Case 13.9125 Total Chicken Sensations matends and packaging costs Cost/Pound $0.30 $0.40 Direct Labor Variable Manufacturing Overhead Total Coversion Cost per Case Total Variable Product Cost per Case Conversion Costs: Poids/Case Dollars/Case 4.5000 Based on labor costs per pound and number of pounds per case 6.0000 Based on var. mfg overhead per pound and number of pounds per case 10.5000 Total conversion costs per case 244125 Total direct material and conversion costs per case Total Cost $ $2,000,000 Retrofit Costs: Useful Life Depreciation 5 $ 400,000 Expected retrofit costs and depreciable life Retrofit Costs WEEK 4 2021-03-22 1.b.: Contribution Margin Format Income Statement Parson Vegetable Company Contribution Margin Income Statement Chicken Sensations SALES (GROSS $) SALES (CASES) $ 63,720,000.00 1,770,000 CASES $ $ 4,248,000.00 $2.40/CASE - FIRST YEAR 3,823,200.00 6% BROKERAGE COMMISSION LESS: VARIABLE COSTS COUPON COMMISSION RAW MATERIALS -----CHICKEN -----VEGETABLES -----SPAETZELS PACKAGING -----BAGS -----BOX LABOR -----DIRECT LABOR -----VAR. MFG OVERHEAD $ 10,620,000.00 $6.00/CASE $ 8,628,750.00 $4.875/CASE $ 597,375.00 $0.3375/CASE $ $ 4,248,000.00 $2.40/CASE 531,000.00 $0.30/CASE $ 7,965,000.00 $4.50/CASE $ 10,620,000.00 $6.00/CASE TOTAL VARIABLE COSTES 51.281.325.00 VARIABLE COST: CONTRIBUTION MARGIN $ 12.438,675.00 CONTRIBUTION MARGIN RATIO 19.52% LESS: FIXED COSTS SLOTTING EXP PACKAGE DESIGN EXP SALES SALARIES (ADDITIONAL) RETROFIT COST EXP $ $ $ $ 6,000,000.00 VIKKI - FIRST YEAR 2,000,000.00 FIRST YEAR 400,000.00 ADDTL BODIES FOR CHICK SENS 400,000.00 $2,000,000 / 5 YRS (NO SALVAGE) TOTAL FIXED COST$ 8.800,000.00 NET INCOME $ 3,638,675.00 1. b. Calculation Notes: 1.c. Breakeven Analysis Breakeven point in Cases SALES (GROSS $) SALES (CASES) $ 63,720,000.00 1,770,000 CASES VARIABLE COST: CONTRIBUTION MARGIN FIXED COST: 12,438,675.00 8,800,000.00 CONTRIBUTION PER CASE $ 7.03 BREAK EVEN CASE SALES 1.252.224 CASES Breakeven point in Sales Dollars SALES (GROSS $) SALES (CASES) 63,720,000.00 1,770,000 CASES $ VARIABLE COST: CONTRIBUTION MARGIN CONTRIBUTION RATIO FIXED COST: 12,438,675.00 19.52% 8,800,000.00 $ CONTRIBUTION PER CASE B.E. CASE SALES DOLLARS 7.03 45.080,042.69 $ 1. d. Margin of Safety a. Margin of Safety (Expected - BreakEven) EXPECTED BREAKEVEN CASES 1,770,000 1,252,224 MARGIN OF SAFETY CASES) 517,776 b. Margin of Safety (Dollars) = (Margin of Safety Cases * Selling Price per Case) SALES $ EXPECTED $63,720,000.00 B.E. CASE SALES DOLLARS $45,080,042.69 MARGIN OF SAFETY $18,639.957.31 C. Margin of Safety Ratio (Expected - BreakEven)/Expected MARGIN OF SAFETY RATIO 29.25%
Step by Step Solution
There are 3 Steps involved in it

Get step-by-step solutions from verified subject matter experts