

Question: In cell G5, enter a formula without a function that subtracts the target revenue (cell F5 ) from the year-to-date revenue (cell E5 ) to
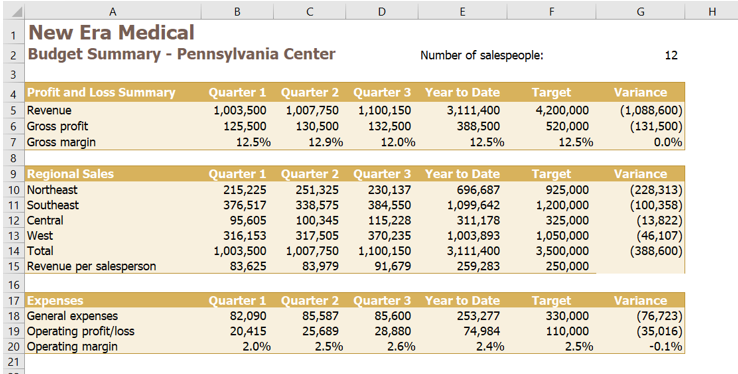
- In cell G5, enter a formula without a function that subtracts the target revenue (cell F5) from the year-to-date revenue (cell E5) to determine how much revenue the field office needs to earn in Quarter 4 to reach its target for the year.
- Josh wants to calculate the gross margin for Quarters 13 and the year to date. Provide this information as follows:
- In cell B7, enter a formula without a function that divides the gross profit for Quarter 1 (cell B6) by the revenue in Quarter 1 (cell B5).
- Fill the range C7:E7 with the formula in cell B7 to find the gross margin for Quarters 2 and 3 and for the year to date.
- Josh needs to sum the sales for each Pennsylvania region for the year to date. Provide this information as follows:
- In cell E10, enter a formula that uses the SUM function to total the regional sales data for the Northeast region (the range B10:D10) to calculate the year-to-date sales.
- Use the Fill Handle to fill the range E11:E13 with the formula in cell E10 to find the year-to-date sales for the other three regions.
- In cell F10, enter the value 925000 to provide the targeted annual sales amount for the Northeast region.
- Josh wants to determine how much revenue each region needs to generate in Quarter 4 to reach its target for the year. Enter this information as follows:
- In cell G10, enter a formula without a function that subtracts the target sales for the Northeast region (cell F10) from its year-to-date regional sales (cell E10) to find the amount of sales the Northeast region needs to generate to meet its target.
- Copy the formula in cell G10, and then paste it in the range G11:G14, pasting the formulas only, to find the variances for the other regions and for the total.
- Josh is interested in how much revenue each of the 12 salespeople generates on average in each quarter and for the year to date. Find this information as follows:
- Edit cell B15 to include a formula without a function that divides the total regional sales in Quarter 1 (cell B14) by the number of salespeople (cell G2). Don't change the reference to cell G2 that is already there.
- Fill the range C15:E15 with the formula in cell B15 to determine the average revenue per salesperson in Quarters 2 and 3 and for the year to date.
- Josh also needs to calculate the operating margin, which is the ratio of operating profit or loss to revenue, and indicates how much the office makes after paying for expenses. Calculate the operating margin as follows:
- In cell B20, enter a formula without a function that divides the operating profit or loss in Quarter 1 (cell B19) by the revenue from Quarter 1 (cell B5).
- Use the Fill Handle to fill the range C20:E20 with the formula in cell B20 to find the operating margin for Quarters 2 and 3 and for the year to date.
- Josh wants to include a visualization of the total year-to-date sales separated by region. Insert a chart to provide this visualization as follows:
- Create a 2-D Pie Chart based on the nonadjacent ranges A9:A13 and E9:E13.
- Enter Total Year to Date Sales by Region as the chart title.
- Resize and reposition the chart so its upper-left corner is in cell I4 and its bottom-right corner is in cell L18.
- Apply Style 3 to the chart.
- Hide the gridlines for the Budget Summary worksheet to make it easier to read.
Step by Step Solution
There are 3 Steps involved in it
1 Expert Approved Answer
Step: 1 Unlock

Question Has Been Solved by an Expert!
Get step-by-step solutions from verified subject matter experts
Step: 2 Unlock
Step: 3 Unlock