

Question: In class we derived a relationship between output per capita and the population level N in an economy using the production function Y KaL a
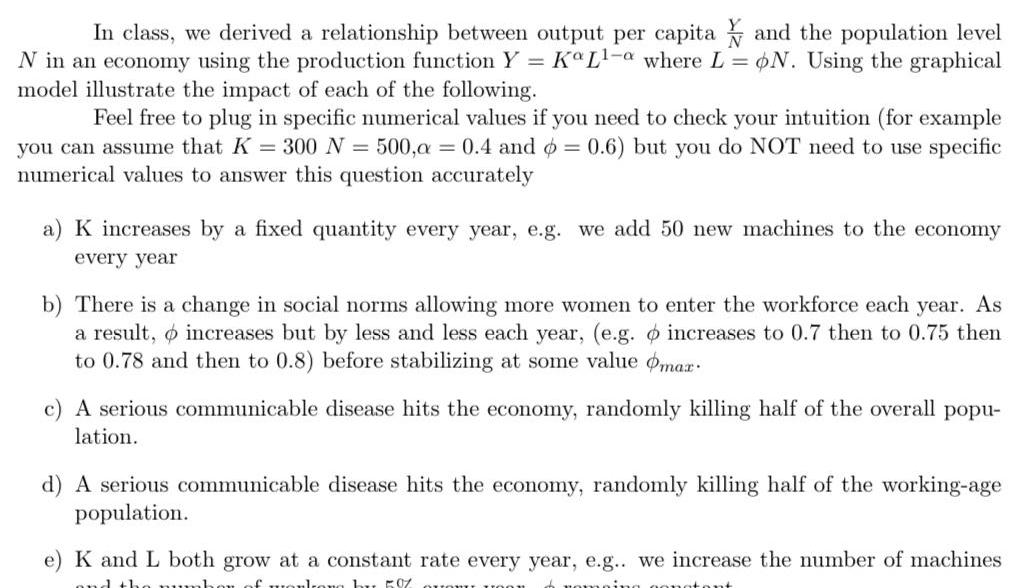

In class we derived a relationship between output per capita and the population level N in an economy using the production function Y KaL a where L ON Using the graphical model illustrate the impact of each of the following Feel free to plug in specific numerical values if you need to check your intuition for example you can assume that K 300 N 500 a 0 4 and p 0 6 but you do NOT need to use specific numerical values to answer this question accurately a K increases by a fixed quantity every year e g we add 50 new machines to the economy every year b There is a change in social norms allowing more women to enter the workforce each year As a result increases but by less and less each year e g o increases to 0 7 then to 0 75 then to 0 78 and then to 0 8 before stabilizing at some value max c A serious communicable disease hits the economy randomly killing half of the overall popu lation d A serious communicable disease hits the economy randomly killing half of the working age population e K and L both grow at a constant rate every year e g we increase the number of machines of mas bu 5 ou 11001 romaine
Step by Step Solution
There are 3 Steps involved in it

Get step-by-step solutions from verified subject matter experts