

Question: In class, we learned that we can assess the impact of a macro indicator by running a regression of the appropriate measure of stock market
In class, we learned that we can assess the impact of a macro indicator by running a regression of the appropriate measure of stock market returns on the appropriate measure of the surprise contained in the announcement of the macro indicator
a. Using the posted spreadsheet, how exactly would you measure a surprise in nonfarm payrolls? Please state your answer by copying and pasting the corresponding Excel formula with cell references below.
b. Using the posted spreadsheet, how exactly would you measure the stock return associated with the nonfarm payroll announcement? Please state your answer by copying and pasting the corresponding Excel formula with cell references below.
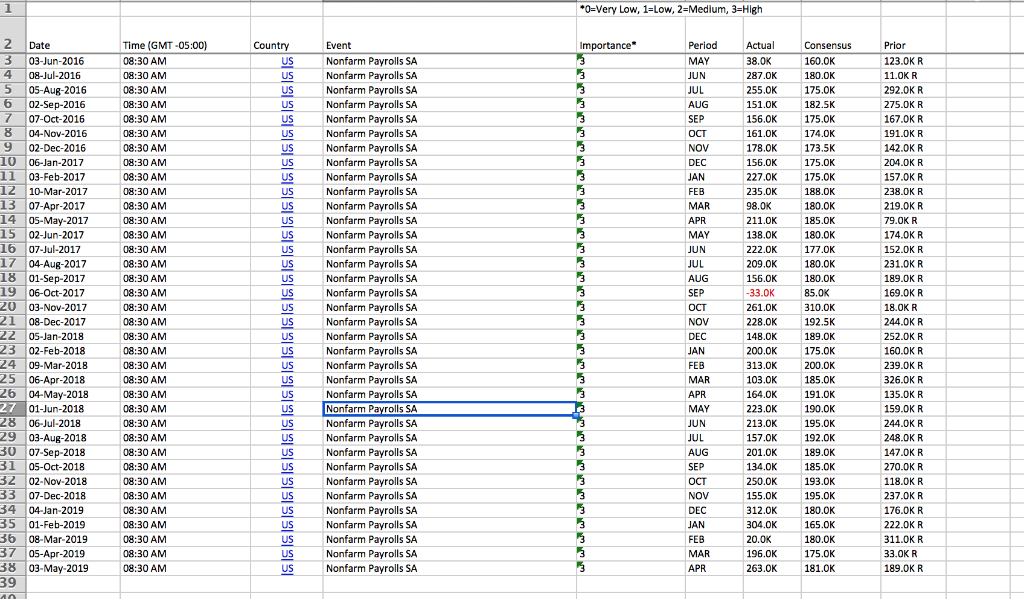
1 2 3 03-Jun-2016 4 08-Jul-2016 5 05-Aug-2016 6 02-Sep-2016 7 07-Oct-2016 8 04-Nov-2016 9 02-Dec-2016 10 06-Jan-2017 11 03-Feb-2017 12 10-Mar-2017 13 07-Apr-2017 14 05-May-2017 15 02-Jun-2017 16 07-Jul-2017 17 04-Aug-2017 18 01-Sep-2017 19 06-Oct-2017 20 03-Nov-2017 21 08-Dec-2017 22 05-Jan-2018 23 02-Feb-2018 Date 24 09-Mar-2018 25 06-Apr-2018 26 04-May-2018 27 01-Jun-2018 28 06-Jul-2018 29 03-Aug-2018 30 07-Sep-2018 31 05-Oct-2018 32 02-Nov-2018 33 07-Dec-2018 34 04-Jan-2019 35 01-Feb-2019 36 08-Mar-2019 37 05-Apr-2019 38 03-May-2019 39 10 Time (GMT-05:00) 08:30 AM 08:30 AM 08:30 AM 08:30 AM 08:30 AM 08:30 AM 08:30 AM 08:30 AM 08:30 AM 08:30 AM 08:30 AM 08:30 AM 08:30 AM 08:30 AM 08:30 AM 08:30 AM 08:30 AM 08:30 AM 08:30 AM 08:30 AM 08:30 AM 08:30 AM 08:30 AM 08:30 AM 08:30 AM 08:30 AM 08:30 AM 08:30 AM 08:30 AM 08:30 AM 08:30 AM 08:30 AM 08:30 AM 08:30 AM 08:30 AM 08:30 AM Country US US US US US US US US US US US US US US US US US US US US US US US US US US US US US US US US US US US US Event Nonfarm Payrolls SA Nonfarm Payrolls SA Nonfarm Payrolls SA Nonfarm Payrolls SA Nonfarm Payrolls SA Nonfarm Payrolls SA Nonfarm Payrolls SA Nonfarm Payrolls SA Nonfarm Payrolls SA Nonfarm Payrolls SA Nonfarm Payrolls SA Nonfarm Payrolls SA Nonfarm Payrolls SA Nonfarm Payrolls SA Nonfarm Payrolls SA Nonfarm Payrolls SA Nonfarm Payrolls SA Nonfarm Payrolls SA Nonfarm Payrolls SA Nonfarm Payrolls SA Nonfarm Payrolls SA Nonfarm Payrolls SA Nonfarm Payrolls SA Nonfarm Payrolls SA Nonfarm Payrolls SA Nonfarm Payrolls SA Nonfarm Payrolls SA Nonfarm Payrolls SA Nonfarm Payrolls SA Nonfarm Payrolls SA Nonfarm Payrolls SA Nonfarm Payrolls SA Nonfarm Payrolls SA Nonfarm Payrolls SA Nonfarm Payrolls SA Nonfarm Payrolls SA *0-Very Low, 1-Low, 2-Medium, 3-High Importance 3 13 13 3 13 3 3 3 13 3 13 13 13 3 3 3 3 13 3 3 13 13 13 3 13 73 13 3 13 13 3 13 13 13 3 Period MAY JUN JUL AUG SEP OCT NOV DEC JAN FEB MAR APR MAY JUN JUL AUG SEP OCT NOV DEC JAN FEB MAR APR MAY JUN JUL AUG SEP OCT NOV DEC JAN FEB MAR APR Actual 38.0K 287.0K 255.0K 151.0K 156.0K 161.0K 178.0K 156.0K 227.0K 235.0K 98.0K 211.0K 138.0K 174.0K 173.5K 175.0K 175.0K 188.0K 180.0K 185.0K 180.0K 177.0K 222.0K 209.0K 180.0K 156.0K 180.0K -33.0K 85.0K 310.0K 261.0K 228.0K 192.5K 148.0K 189.0K 200.0K 175.0K 313.0K 200.0K 103.0K 185.0K 164.0K 191.0K 223.0K 190.0K 213.0K 195.0K 157.0K 192.0K 189.0K 185.0K 193.0K 195.0K 180.0K 165.0K 180.0K 175.0K 181.0K 201.0K 134.0K Consensus 160.0K 180.0K 175.0K 182.5K 175.0K 250.0K 155.0K 312.0K 304.0K 20.0K 196.0K 263.0K Prior 123.0K R 11.0K R 292.0K R 275.0K R 167.0K R 191.0K R 142.0K R 204.0K R 157.OK R 238.0K R 219.0K R 79.0K R 174.0K R 152.0K R 231.0K R 189.0K R 169.0K R 18.0K R 244.0K R 252.0K R 160.0K R 239.0K R 326.0K R 135.0K R 159.0K R 244.0K R 248.0K R 147.0K R 270.0K R 118.0K R 237.0K R 176.0K R 222.0K R 311.0K R 33.0K R 189.0K R
Step by Step Solution
3.45 Rating (161 Votes )
There are 3 Steps involved in it
To measure the surprise in nonfarm payrolls and the stock return associated with the announcement ... View full answer

Get step-by-step solutions from verified subject matter experts