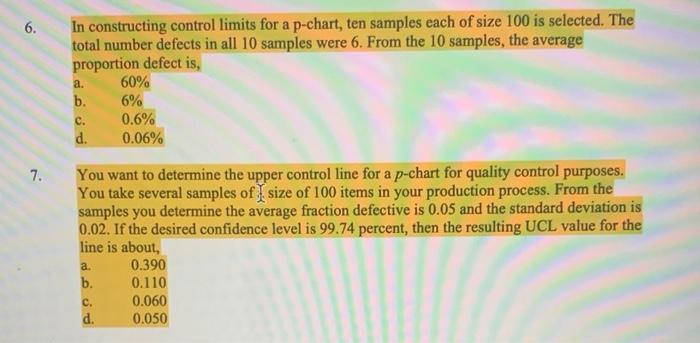
Question: In constructing control limits for a p-chart, ten samples each of size 100 is selected. The total number defects in all 10 samples were 6

In constructing control limits for a p-chart, ten
In constructing control limits for a p-chart, ten samples each of size 100 is selected. The total number defects in all 10 samples were 6 . From the 10 samples, the average proportion defect is, a. 60% b. 6% c. 0.6% d. 0.06% You want to determine the upper control line for a p-chart for quality control purposes. You take several samples of X size of 100 items in your production process. From the samples you determine the average fraction defective is 0.05 and the standard deviation is 0.02. If the desired confidence level is 99.74 percent, then the resulting UCL value for the line is about, a. 0.390 b. 0.110 c. 0.060 d. 0.050 A hotel tracks the number of complaints per month. When the process is in control, there is an average of 36 complaints per month. Assume the number of complaints per month is distributed as Poisson. The lower and upper control limits (LCL,UCL) for a c-chart using 90% level of confidence are about, a. (0.00,36.00) b. (20.00,36.00) c. (26.00,46.00) d. (24.00,48.00) 10. In constructing control limits for a c-chart, what is type I error when we use 95 percent level of confidence? a. 4.56% b. 0.026% c. 5% d. 1%

Step by Step Solution

There are 3 Steps involved in it

1 Expert Approved Answer
Step: 1 Unlock blur-text-image
Question Has Been Solved by an Expert!

Get step-by-step solutions from verified subject matter experts

Step: 2 Unlock
Step: 3 Unlock

Students Have Also Explored These Related General Management Questions!