

In December of the prior year, sales were forecasted as follows: January, 96 units; February, 91...
Fantastic news! We've Found the answer you've been seeking!
Question:
Transcribed Image Text:
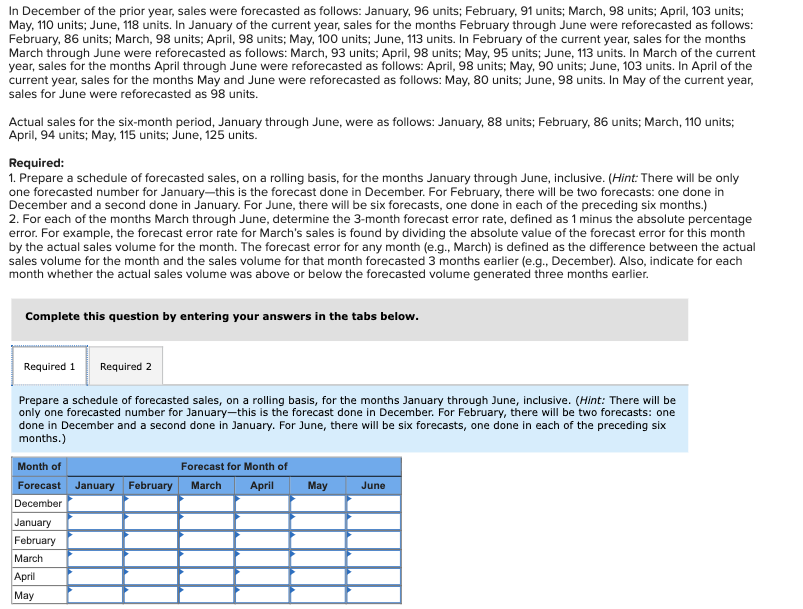
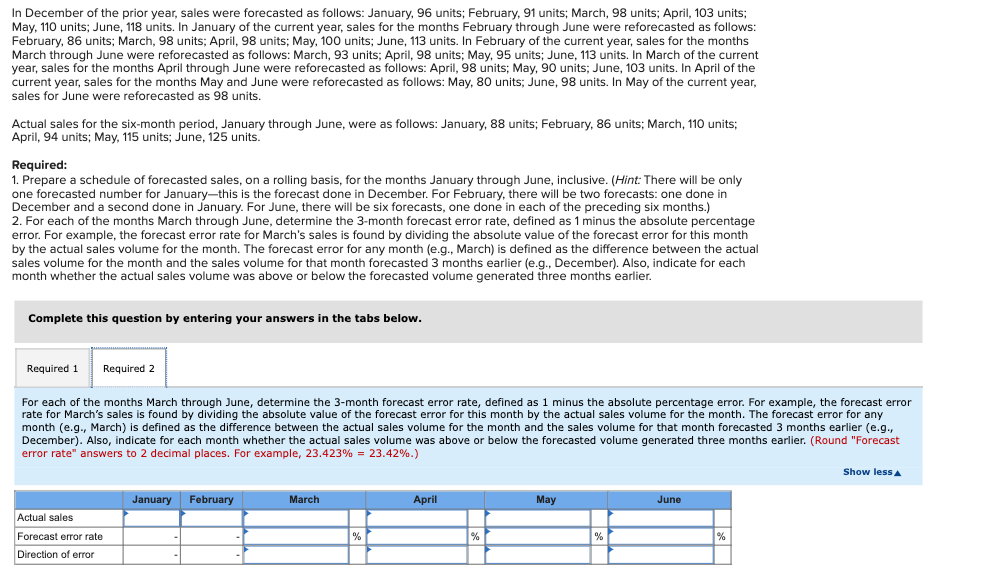
In December of the prior year, sales were forecasted as follows: January, 96 units; February, 91 units; March, 98 units; April, 103 units; May, 110 units; June, 118 units. In January of the current year, sales for the months February through June were reforecasted as follows: February, 86 units; March, 98 units; April, 98 units; May, 100 units; June, 113 units. In February of the current year, sales for the months March through June were reforecasted as follows: March, 93 units; April, 98 units; May, 95 units; June, 113 units. In March of the current year, sales for the months April through June were reforecasted as follows: April, 98 units; May, 90 units; June, 103 units. In April of the current year, sales for the months May and June were reforecasted as follows: May, 80 units; June, 98 units. In May of the current year, sales for June were reforecasted as 98 units. Actual sales for the six-month period, January through June, were as follows: January, 88 units; February, 86 units; March, 110 units; April, 94 units; May, 115 units; June, 125 units. Required: 1. Prepare a schedule of forecasted sales, on a rolling basis, for the months January through June, inclusive. (Hint: There will be only one forecasted number for January-this is the forecast done in December. For February, there will be two forecasts: one done in December and a second done in January. For June, there will be six forecasts, one done in each of the preceding six months.) 2. For each of the months March through June, determine the 3-month forecast error rate, defined as 1 minus the absolute percentage error. For example, the forecast error rate for March's sales is found by dividing the absolute value of the forecast error for this month by the actual sales volume for the month. The forecast error for any month (e.g., March) is defined as the difference between the actual sales volume for the month and the sales volume for that month forecasted 3 months earlier (e.g., December). Also, indicate for each month whether the actual sales volume was above or below the forecasted volume generated three months earlier. Complete this question by entering your answers in the tabs below. Required 1 Required 2 Prepare a schedule of forecasted sales, on a rolling basis, for the months January through June, inclusive. (Hint: There will be only one forecasted number for January-this is the forecast done in December. For February, there will be two forecasts: one done in December and a second done in January. For June, there will be six forecasts, one done in each of the preceding six months.) Month of Forecast for Month of April May June Forecast January February March December January February March April May In December of the prior year, sales were forecasted as follows: January, 96 units; February, 91 units; March, 98 units; April, 103 units; May, 110 units; June, 118 units. In January of the current year, sales for the months February through June were reforecasted as follows: February, 86 units; March, 98 units; April, 98 units; May, 100 units; June, 113 units. In February of the current year, sales for the months March through June were reforecasted as follows: March, 93 units; April, 98 units; May, 95 units; June, 113 units. In March of the current year, sales for the months April through June were reforecasted as follows: April, 98 units; May, 90 units; June, 103 units. In April of the current year, sales for the months May and June were reforecasted as follows: May, 80 units; June, 98 units. In May of the current year, sales for June were reforecasted as 98 units. Actual sales for the six-month period, January through June, were as follows: January, 88 units; February, 86 units; March, 110 units; April, 94 units; May, 115 units; June, 125 units. Required: 1. Prepare a schedule of forecasted sales, on a rolling basis, for the months January through June, inclusive. (Hint: There will be only one forecasted number for January-this is the forecast done in December. For February, there will be two forecasts: one done in December and a second done in January. For June, there will be six forecasts, one done in each of the preceding six months.) 2. For each of the months March through June, determine the 3-month forecast error rate, defined as 1 minus the absolute percentage error. For example, the forecast error rate for March's sales is found by dividing the absolute value of the forecast error for this month by the actual sales volume for the month. The forecast error for any month (e.g., March) is defined as the difference between the actual sales volume for the month and the sales volume for that month forecasted 3 months earlier (e.g., December). Also, indicate for each month whether the actual sales volume was above or below the forecasted volume generated three months earlier. Complete this question by entering your answers in the tabs below. Required 1 Required 2 For each of the months March through June, determine the 3-month forecast error rate, defined as 1 minus the absolute percentage error. For example, the forecast error rate for March's sales is found by dividing the absolute value of the forecast error for this month by the actual sales volume for the month. The forecast error for any month (e.g., March) is defined as the difference between the actual sales volume for the month and the sales volume for that month forecasted 3 months earlier (e.g., December). Also, indicate for each month whether the actual sales volume was above or below the forecasted volume generated three months earlier. (Round "Forecast error rate" answers to 2 decimal places. For example, 23.423% = 23.42%.) Actual sales Forecast error rate Direction of error January February March April % % May % June % Show less In December of the prior year, sales were forecasted as follows: January, 96 units; February, 91 units; March, 98 units; April, 103 units; May, 110 units; June, 118 units. In January of the current year, sales for the months February through June were reforecasted as follows: February, 86 units; March, 98 units; April, 98 units; May, 100 units; June, 113 units. In February of the current year, sales for the months March through June were reforecasted as follows: March, 93 units; April, 98 units; May, 95 units; June, 113 units. In March of the current year, sales for the months April through June were reforecasted as follows: April, 98 units; May, 90 units; June, 103 units. In April of the current year, sales for the months May and June were reforecasted as follows: May, 80 units; June, 98 units. In May of the current year, sales for June were reforecasted as 98 units. Actual sales for the six-month period, January through June, were as follows: January, 88 units; February, 86 units; March, 110 units; April, 94 units; May, 115 units; June, 125 units. Required: 1. Prepare a schedule of forecasted sales, on a rolling basis, for the months January through June, inclusive. (Hint: There will be only one forecasted number for January-this is the forecast done in December. For February, there will be two forecasts: one done in December and a second done in January. For June, there will be six forecasts, one done in each of the preceding six months.) 2. For each of the months March through June, determine the 3-month forecast error rate, defined as 1 minus the absolute percentage error. For example, the forecast error rate for March's sales is found by dividing the absolute value of the forecast error for this month by the actual sales volume for the month. The forecast error for any month (e.g., March) is defined as the difference between the actual sales volume for the month and the sales volume for that month forecasted 3 months earlier (e.g., December). Also, indicate for each month whether the actual sales volume was above or below the forecasted volume generated three months earlier. Complete this question by entering your answers in the tabs below. Required 1 Required 2 Prepare a schedule of forecasted sales, on a rolling basis, for the months January through June, inclusive. (Hint: There will be only one forecasted number for January-this is the forecast done in December. For February, there will be two forecasts: one done in December and a second done in January. For June, there will be six forecasts, one done in each of the preceding six months.) Month of Forecast for Month of April May June Forecast January February March December January February March April May In December of the prior year, sales were forecasted as follows: January, 96 units; February, 91 units; March, 98 units; April, 103 units; May, 110 units; June, 118 units. In January of the current year, sales for the months February through June were reforecasted as follows: February, 86 units; March, 98 units; April, 98 units; May, 100 units; June, 113 units. In February of the current year, sales for the months March through June were reforecasted as follows: March, 93 units; April, 98 units; May, 95 units; June, 113 units. In March of the current year, sales for the months April through June were reforecasted as follows: April, 98 units; May, 90 units; June, 103 units. In April of the current year, sales for the months May and June were reforecasted as follows: May, 80 units; June, 98 units. In May of the current year, sales for June were reforecasted as 98 units. Actual sales for the six-month period, January through June, were as follows: January, 88 units; February, 86 units; March, 110 units; April, 94 units; May, 115 units; June, 125 units. Required: 1. Prepare a schedule of forecasted sales, on a rolling basis, for the months January through June, inclusive. (Hint: There will be only one forecasted number for January-this is the forecast done in December. For February, there will be two forecasts: one done in December and a second done in January. For June, there will be six forecasts, one done in each of the preceding six months.) 2. For each of the months March through June, determine the 3-month forecast error rate, defined as 1 minus the absolute percentage error. For example, the forecast error rate for March's sales is found by dividing the absolute value of the forecast error for this month by the actual sales volume for the month. The forecast error for any month (e.g., March) is defined as the difference between the actual sales volume for the month and the sales volume for that month forecasted 3 months earlier (e.g., December). Also, indicate for each month whether the actual sales volume was above or below the forecasted volume generated three months earlier. Complete this question by entering your answers in the tabs below. Required 1 Required 2 For each of the months March through June, determine the 3-month forecast error rate, defined as 1 minus the absolute percentage error. For example, the forecast error rate for March's sales is found by dividing the absolute value of the forecast error for this month by the actual sales volume for the month. The forecast error for any month (e.g., March) is defined as the difference between the actual sales volume for the month and the sales volume for that month forecasted 3 months earlier (e.g., December). Also, indicate for each month whether the actual sales volume was above or below the forecasted volume generated three months earlier. (Round "Forecast error rate" answers to 2 decimal places. For example, 23.423% = 23.42%.) Actual sales Forecast error rate Direction of error January February March April % % May % June % Show less
Expert Answer:

Related Book For 

Cost management a strategic approach
ISBN: 978-0073526942
5th edition
Authors: Edward J. Blocher, David E. Stout, Gary Cokins
Posted Date:
Students also viewed these accounting questions
-
Compare Figure 3.21 with Figure 3.23, and explain the difference between the geodatabase and the coverage in handling the route data structure. Route ID 1 1 1 07 Section- ID 1 2 1 3 Figure 3.21 The...
-
Reading material Raymond Frost, Alexa K. Fox & Judy Strauss (2019). Product: The Online Offer. E-Marketing , 9, 206 - 228. Raymond Frost, Alexa K. Fox & Judy Strauss (2019). Price: The Online Value....
-
Which of the following is incorrect regarding the autonomic nervous system? a. It includes both cranial and spinal nerves. b. It is divided into sympathetic and parasympathetic divisions. c. Most...
-
One end of a string is secured to the ceiling and a metal ball of mass 50 g is tied to its other end. The ball is initially at rest in the vertical position. The ball is raised through a vertical...
-
Refer to the information in Exercise 17-4. Required 1. Compute a departmental overhead rate for the molding department based on machine hours and a department overhead rate for the trimming...
-
The following are selected transactions of Graves Company. Graves prepares financial statements quarterly. Jan. 2 Purchased merchandise on account from Ally Company, $30,000, terms 2/10, n/30....
-
What are some practical advantages to using a star schema data model over a relational model in healthcare?
-
A computer system operates with two parallel processors P1 and P2. The total capacity (queue and server included) of P1 is K = 1, and that of P2 is K= 2. The system receives two types of jobs,...
-
4) Solve the initial value problem y" - 3y + 2y = 8(t-2); y(0) = 0, y'(0) = 1.
-
is a condition where an element of a surface or an axis is a straight line. Straightness Flatness Circularity Cylindricity
-
Identify and explain the operation of the ladder logic in Figure Q1 (d). How is this different from the use of a Conditional Jump command? (5 marks) X001 HE X002 HH X003 11 X004 Figure Q1 (d) [MC N1...
-
A rotating shaft carries three unbalanced masses of 4 kg, 3 kg, and 2.4 kg at radial distances of 75 mm, 85 mm and 50 mm and at the angular positions of 45, 135 and 240 respectively. The planes of...
-
Combine with "laser cladding" topic, please give an example of forced vibration of a single- degree-of-freedom system, and try to construct a system to reduce the vibration by adding a spring and...
-
Hearty Soup Co. uses a process cost system A type of cost system that accumulates costs for each of the various departments within a manufacturing facility. to record the costs of processing soup,...
-
Define deferred revenue. Why is it a liability?
-
Why does management need to separate direct labor variances into rate and efficiency components?
-
Assume the following for Black Top, Inc., for 2010. Black Top applies overhead on the basis of units produced. Budgeted overhead ........... $210,000 Actual overhead ........... $222,000 Actual...
-
Waymouth Manufacturing operates a contract manufacturing plant located in Dublin, Ireland. The plant provides a variety of electronics products and components to consumer goods manufacturers around...
-
Which of the following statements regarding applications of ETFs in portfolio management is correct? A. Equity ETFs tend to be more active than fixed-income ETFs. B. The range of risk exposures...
-
Which of Stosurs statements regarding ETF mechanics is correct? A. Statement 1 B. Statement 2 C. Statement 3 Howie Rutledge is a senior portfolio strategist for an endowment fund. Rutledge meets with...
-
Factor (smart beta) strategy ETFs are least likely to be used by investors: A. to modify portfolio risk. B. for tactical trading purposes. C. to seek outperformance versus a benchmark.

Study smarter with the SolutionInn App