

In December of the prior year, sales were forecasted as follows: January, 96 units; February, 91...
Fantastic news! We've Found the answer you've been seeking!
Question:
Transcribed Image Text:
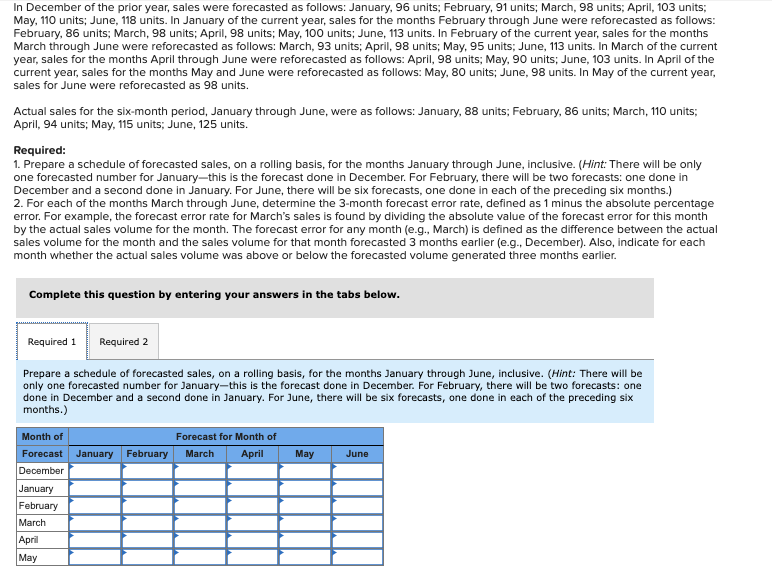
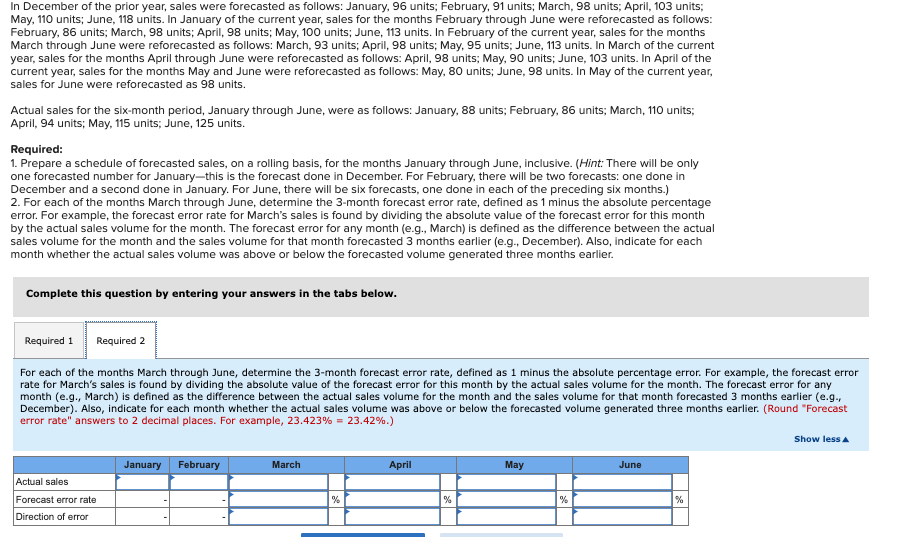
In December of the prior year, sales were forecasted as follows: January, 96 units; February, 91 units; March, 98 units; April, 103 units; May, 110 units; June, 118 units. In January of the current year, sales for the months February through June were reforecasted as follows: February, 86 units; March, 98 units; April, 98 units; May, 100 units; June, 113 units. In February of the current year, sales for the months March through June were reforecasted as follows: March, 93 units; April, 98 units; May, 95 units; June, 113 units. In March of the current year, sales for the months April through June were reforecasted as follows: April, 98 units; May, 90 units; June, 103 units. In April of the current year, sales for the months May and June were reforecasted as follows: May, 80 units; June, 98 units. In May of the current year, sales for June were reforecasted as 98 units. Actual sales for the six-month period, January through June, were as follows: January, 88 units; February, 86 units; March, 110 units; April, 94 units; May, 115 units; June, 125 units. Required: 1. Prepare a schedule of forecasted sales, on a rolling basis, for the months January through June, inclusive. (Hint: There will be only one forecasted number for January-this is the forecast done in December. For February, there will be two forecasts: one done in December and a second done in January. For June, there will be six forecasts, one done in each of the preceding six months.) 2. For each of the months March through June, determine the 3-month forecast error rate, defined as 1 minus the absolute percentage error. For example, the forecast error rate for March's sales is found by dividing the absolute value of the forecast error for this month by the actual sales volume for the month. The forecast error for any month (e.g., March) is defined as the difference between the actual sales volume for the month and the sales volume for that month forecasted 3 months earlier (e.g., December). Also, indicate for each month whether the actual sales volume was above or below the forecasted volume generated three months earlier. Complete this question by entering your answers in the tabs below. Required 1 Required 2 Prepare a schedule of forecasted sales, on a rolling basis, for the months January through June, inclusive. (Hint: There will be only one forecasted number for January-this is the forecast done in December. For February, there will be two forecasts: one done in December and a second done in January. For June, there will be six forecasts, one done in each of the preceding six months.) Month of Forecast for Month of April May June Forecast January February March December January February March April May In December of the prior year, sales were forecasted as follows: January, 96 units; February, 91 units; March, 98 units; April, 103 units; May, 110 units; June, 118 units. In January of the current year, sales for the months February through June were reforecasted as follows: February, 86 units; March, 98 units; April, 98 units; May, 100 units; June, 113 units. In February of the current year, sales for the months March through June were reforecasted as follows: March, 93 units; April, 98 units; May, 95 units; June, 113 units. In March of the current year, sales for the months April through June were reforecasted as follows: April, 98 units; May, 90 units; June, 103 units. In April of the current year, sales for the months May and June were reforecasted as follows: May, 80 units; June, 98 units. In May of the current year, sales for June were reforecasted as 98 units. Actual sales for the six-month period, January through June, were as follows: January, 88 units; February, 86 units; March, 110 units; April, 94 units; May, 115 units; June, 125 units. Required: 1. Prepare a schedule of forecasted sales, on a rolling basis, for the months January through June, inclusive. (Hint: There will be only one forecasted number for January-this is the forecast done in December. For February, there will be two forecasts: one done in December and a second done in January. For June, there will be six forecasts, one done in each of the preceding six months.) 2. For each of the months March through June, determine the 3-month forecast error rate, defined as 1 minus the absolute percentage error. For example, the forecast error rate for March's sales is found by dividing the absolute value of the forecast error for this month by the actual sales volume for the month. The forecast error for any month (e.g., March) is defined as the difference between the actual sales volume for the month and the sales volume for that month forecasted 3 months earlier (e.g., December). Also, indicate for each month whether the actual sales volume was above or below the forecasted volume generated three months earlier. Complete this question by entering your answers in the tabs below. Required 1 Required 2 For each of the months March through June, determine the 3-month forecast error rate, defined as 1 minus the absolute percentage error. For example, the forecast error rate for March's sales is found by dividing the absolute value of the forecast error for this month by the actual sales volume for the month. The forecast error for any month (e.g., March) is defined as the difference between the actual sales volume for the month and the sales volume for that month forecasted 3 months earlier (e.g., December). Also, indicate for each month whether the actual sales volume was above or below the forecasted volume generated three months earlier. (Round "Forecast error rate" answers to 2 decimal places. For example, 23.423% = 23.42%.) Actual sales Forecast error rate Direction of error January February March % April % May % June % Show less In December of the prior year, sales were forecasted as follows: January, 96 units; February, 91 units; March, 98 units; April, 103 units; May, 110 units; June, 118 units. In January of the current year, sales for the months February through June were reforecasted as follows: February, 86 units; March, 98 units; April, 98 units; May, 100 units; June, 113 units. In February of the current year, sales for the months March through June were reforecasted as follows: March, 93 units; April, 98 units; May, 95 units; June, 113 units. In March of the current year, sales for the months April through June were reforecasted as follows: April, 98 units; May, 90 units; June, 103 units. In April of the current year, sales for the months May and June were reforecasted as follows: May, 80 units; June, 98 units. In May of the current year, sales for June were reforecasted as 98 units. Actual sales for the six-month period, January through June, were as follows: January, 88 units; February, 86 units; March, 110 units; April, 94 units; May, 115 units; June, 125 units. Required: 1. Prepare a schedule of forecasted sales, on a rolling basis, for the months January through June, inclusive. (Hint: There will be only one forecasted number for January-this is the forecast done in December. For February, there will be two forecasts: one done in December and a second done in January. For June, there will be six forecasts, one done in each of the preceding six months.) 2. For each of the months March through June, determine the 3-month forecast error rate, defined as 1 minus the absolute percentage error. For example, the forecast error rate for March's sales is found by dividing the absolute value of the forecast error for this month by the actual sales volume for the month. The forecast error for any month (e.g., March) is defined as the difference between the actual sales volume for the month and the sales volume for that month forecasted 3 months earlier (e.g., December). Also, indicate for each month whether the actual sales volume was above or below the forecasted volume generated three months earlier. Complete this question by entering your answers in the tabs below. Required 1 Required 2 Prepare a schedule of forecasted sales, on a rolling basis, for the months January through June, inclusive. (Hint: There will be only one forecasted number for January-this is the forecast done in December. For February, there will be two forecasts: one done in December and a second done in January. For June, there will be six forecasts, one done in each of the preceding six months.) Month of Forecast for Month of April May June Forecast January February March December January February March April May In December of the prior year, sales were forecasted as follows: January, 96 units; February, 91 units; March, 98 units; April, 103 units; May, 110 units; June, 118 units. In January of the current year, sales for the months February through June were reforecasted as follows: February, 86 units; March, 98 units; April, 98 units; May, 100 units; June, 113 units. In February of the current year, sales for the months March through June were reforecasted as follows: March, 93 units; April, 98 units; May, 95 units; June, 113 units. In March of the current year, sales for the months April through June were reforecasted as follows: April, 98 units; May, 90 units; June, 103 units. In April of the current year, sales for the months May and June were reforecasted as follows: May, 80 units; June, 98 units. In May of the current year, sales for June were reforecasted as 98 units. Actual sales for the six-month period, January through June, were as follows: January, 88 units; February, 86 units; March, 110 units; April, 94 units; May, 115 units; June, 125 units. Required: 1. Prepare a schedule of forecasted sales, on a rolling basis, for the months January through June, inclusive. (Hint: There will be only one forecasted number for January-this is the forecast done in December. For February, there will be two forecasts: one done in December and a second done in January. For June, there will be six forecasts, one done in each of the preceding six months.) 2. For each of the months March through June, determine the 3-month forecast error rate, defined as 1 minus the absolute percentage error. For example, the forecast error rate for March's sales is found by dividing the absolute value of the forecast error for this month by the actual sales volume for the month. The forecast error for any month (e.g., March) is defined as the difference between the actual sales volume for the month and the sales volume for that month forecasted 3 months earlier (e.g., December). Also, indicate for each month whether the actual sales volume was above or below the forecasted volume generated three months earlier. Complete this question by entering your answers in the tabs below. Required 1 Required 2 For each of the months March through June, determine the 3-month forecast error rate, defined as 1 minus the absolute percentage error. For example, the forecast error rate for March's sales is found by dividing the absolute value of the forecast error for this month by the actual sales volume for the month. The forecast error for any month (e.g., March) is defined as the difference between the actual sales volume for the month and the sales volume for that month forecasted 3 months earlier (e.g., December). Also, indicate for each month whether the actual sales volume was above or below the forecasted volume generated three months earlier. (Round "Forecast error rate" answers to 2 decimal places. For example, 23.423% = 23.42%.) Actual sales Forecast error rate Direction of error January February March % April % May % June % Show less
Expert Answer:

Related Book For 

Cost management a strategic approach
ISBN: 978-0073526942
5th edition
Authors: Edward J. Blocher, David E. Stout, Gary Cokins
Posted Date:
Students also viewed these accounting questions
-
Compare Figure 3.21 with Figure 3.23, and explain the difference between the geodatabase and the coverage in handling the route data structure. Route ID 1 1 1 07 Section- ID 1 2 1 3 Figure 3.21 The...
-
Q4 11 Points 4. Consider the following Current Data for ABC Corp.: Debt Equity Market Value (in millions of $) 16,000 26,000 Cost 7% 14% If ABC moves to and maintains a debt-to-value (D/V) ratio of...
-
The th ick filaments of a muscle fiber are made up of a. Actin. b. Troponin. c. Fascia. d. Myosin.
-
Identify the features of the motion of the trolley in Figure 18.3 that satisfy the three requirements for s.h.m.
-
Your instructor will divide your class randomly into groups of four to six people. Acting as a team, with everyone offering ideas and one person serving as official recorder, each group will be...
-
Brisky Corporation had net sales of $2,400,000 and interest revenue of $31,000 during 2012. Expenses for 2012 were: cost of goods sold $1,450,000; administrative expenses $212,000; selling expenses...
-
What are the key components of a relational database management system? Why are relational database management systems different from database models that preceded the relational model?
-
ABC company maintains its records cash basis of accounting during the year and then converts them to accrual basis at the end of the year through adjusting entries. While preparing the financial...
-
3. In the diagram, both particles have a charge Q = + 5.0 nC and a mass of 2.0 g. (4.5- pnts) A) Calculate the electric potential at 6.0 cm on the x-axis. y.cm Q B) What is the electric potential...
-
Let us consider the following two relations R(A, B, C) and 5(B, C. D). R S A B B 4 D 51 6 3 7 8 1 5 8 9 11 38 6 8 6 3 86 8 715 Compute the following relational algebra: O(A
-
4. (10%) Please use the hill-climbing method (5%) and the best-first search method (5%) respectively to solve the 8-puzzle problem with the following initial state (left) and final goal state...
-
2. Answer the following questions with their reasons. a) Is it possible to start from point C and return to point C by crossing each bridge only once? b) Is E, B, D, A, C a Hamilton path? c) Is C, A,...
-
lov A sample of unknown liquid is poured into a graduated cylinder and the volume of the unknown is 23.5 mL. The liquid used to fill the cylinder weighs 98.4 g. From this information, calculate the...
-
Give a counter example to show that the following construction fails to prove that the class of context-free languages is closed under star. Let A be a CFL that is generated by the CFG G = (V, , R,...
-
Listed below are common types of current liabilities, contingencies, and commitments: a. Accounts payable b. Bank loans and commercial paper c. Notes payable d. Dividends payable e. Sales and excise...
-
Identify four or five potential critical success factors for a manufacturer of industrial chemicals. Explain why you consider those factors critical for the firm to be successful.
-
Fashion House, a manufacturer of high-fashion clothing for women, is located in South London. Its product line consists of trousers (45 percent), skirts (35 percent) , dresses (15 percent), and other...
-
Habib Manufacturing has five manufacturing departments and operating and cost information for the most recent two months of activity. Required Identify whether the cost in each department is fixed,...
-
Which transaction would generate foreign currency transaction exposure for Ambleu? A . Transaction 1 B . Transaction 2 C . Transaction 3
-
Based on Exhibit 1, what is the foreign exchange gain resulting from Transaction 3 on the December 31, 2016 fi nancial statements? A . NVK1.70 per ton B . NVK90.75 per ton C . NVK248.54 per ton
-
In response to the boards second question, Templeton should reply that if the change is made, the consolidated fi nancial statements for Consolidated Motors would begin to recognize: A . realized...

Study smarter with the SolutionInn App