

Question: in each sample. Edith has also calculated sample means and sample ranges which are shown in the last two columns ( Mean and Range )
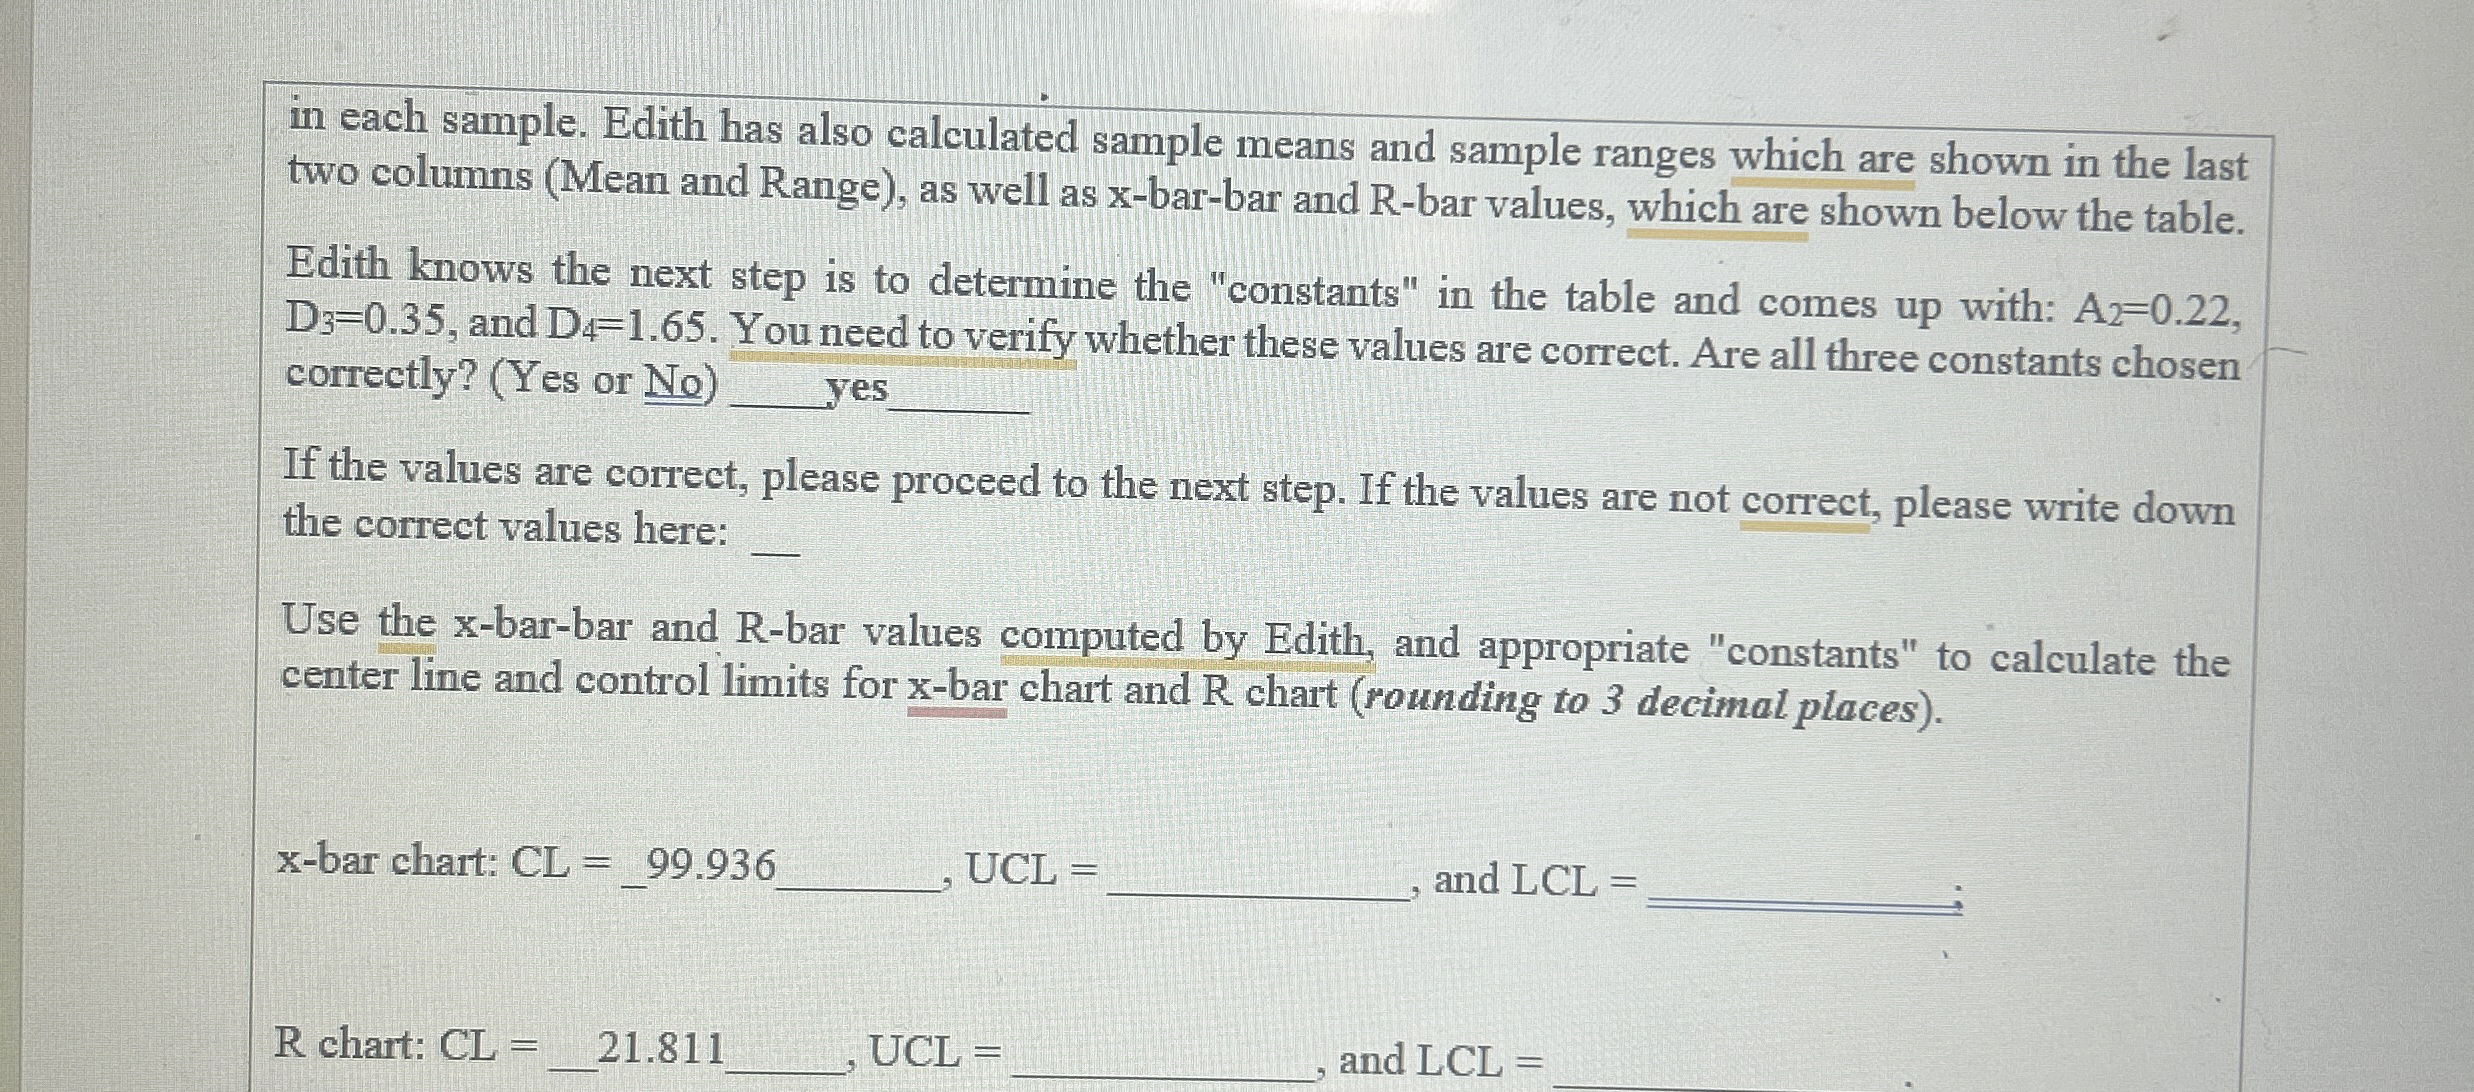
in each sample. Edith has also calculated sample means and sample ranges which are shown in the last
two columns Mean and Range as well as xbarbar and Rbar values, which are shown below the table.
Edith knows the next step is to determine the "constants" in the table and comes up with:
and You need to verify whether these values are correct. Are all three constants chosen
correctly? Yes or No yes
If the values are correct, please proceed to the next step. If the values are not correct, please write down
the correct values here:
Use the x barbar and Rbar values computed by Edith, and appropriate "constants" to calculate the
center line and control limits for x bar chart and R chart rounding to decimal places
xbar chart: CL
UCL
and
;
R chart:
UCL
and
Step by Step Solution
There are 3 Steps involved in it
1 Expert Approved Answer
Step: 1 Unlock

Question Has Been Solved by an Expert!
Get step-by-step solutions from verified subject matter experts
Step: 2 Unlock
Step: 3 Unlock