

Question: In excel, copy this table. Using the information, show in a table the values of each portfolio with respect to variations in the stock's price.
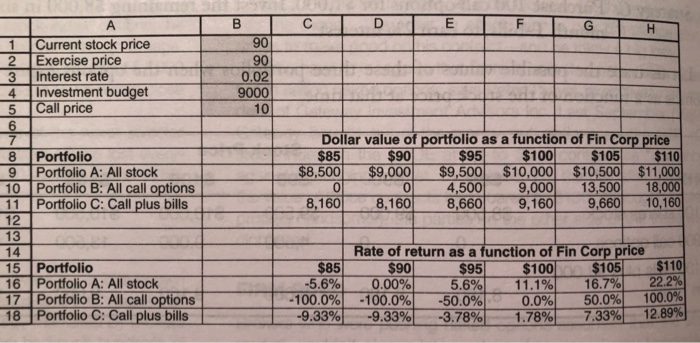
M 1 2 Current stock price Exercise price Interest rate Investment budget Call price 90 90 0.02 9000 5 MODO Dollar value of portfolio as a function of Fin Corp price $85 $90 $95 $100 $105 $110 $8,500 $9,000 $9,500 $10,000 $10,500 $11,000 0 0 4 ,500 9,000 13,500 18,000 8,160 8,160 8,660 9,660 10,160 8 Portfolio 9 Portfolio A: All stock 10 Portfolio B: All call options 11 Portfolio C: Call plus bills 12 13 14 15 Portfolio 16 Portfolio A: All stock 17 Portfolio B: All call options 18 Portfolio C: Call plus bills Rate of return as a function of Fin Corp price $851 $90 $95 $100 $105 $110 -5.6% 0.00% 5.6% 11.1% 16.7% -100.0% -100.0% -50.0% 0.0% 50.0% 100.0% -9.33% -9.33% -3.78% 1.78% 7.33% 12.89%
Step by Step Solution
There are 3 Steps involved in it

Get step-by-step solutions from verified subject matter experts