

Question: In Excel, fix up the mean, standard deviation, sample size, and standard error, as well as confidence intervals, for male and female mate choices. Graph
In Excel, fix up the mean, standard deviation, sample size, and standard error, as well as confidence intervals, for male and female mate choices. Graph the two means and add custom error bars to those means using the confidence interval values, and include a brieffigure caption. Additionally, please briefly answer the following questionsin a text box within your Excel sheet:
- What did you hypothesize about the outcome of this experiment (prior to looking at the data!)?
- Do the data provide evidence to support your hypothesis ? Explain (in other words, interpret your graph).
- How does this experiment relate to the concept of sexual selection? (Hint: mate choice based on coloration and morphological features)
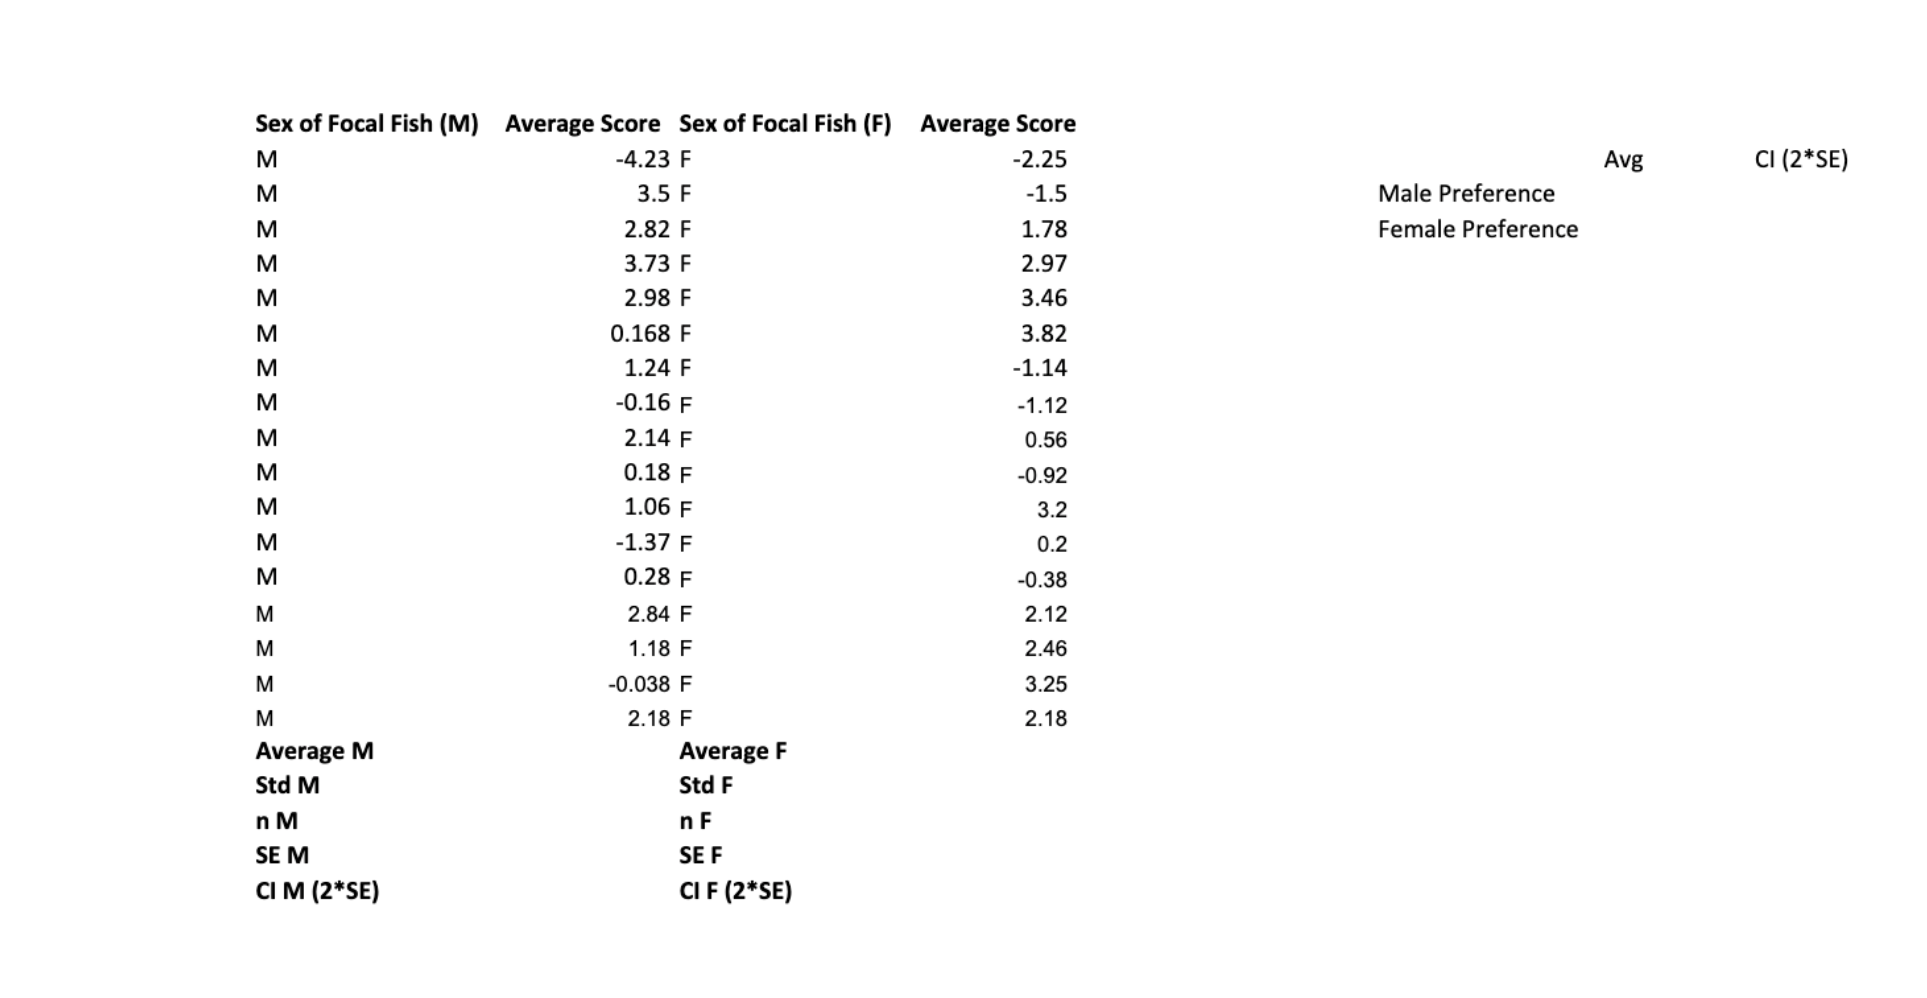
Sex of Focal Fish (M) Average Score Sex of Focal Fish (F) Average Score M -4.23 F -2.25 Avg CI (2*SE) M 3.5 F -1.5 Male Preference M 2.82 F 1.78 Female Preference 3.73 F 2.97 2.98 F 3.46 0.168 F 3.82 1.24 F -1.14 -0.16 F -1.12 2.14 F 0.56
Step by Step Solution
There are 3 Steps involved in it
1 Expert Approved Answer
Step: 1 Unlock

Question Has Been Solved by an Expert!
Get step-by-step solutions from verified subject matter experts
Step: 2 Unlock
Step: 3 Unlock