

Question: In Excel how would you solve this question The table below shows the preferences for elective courses of students who are undecided about their majors.
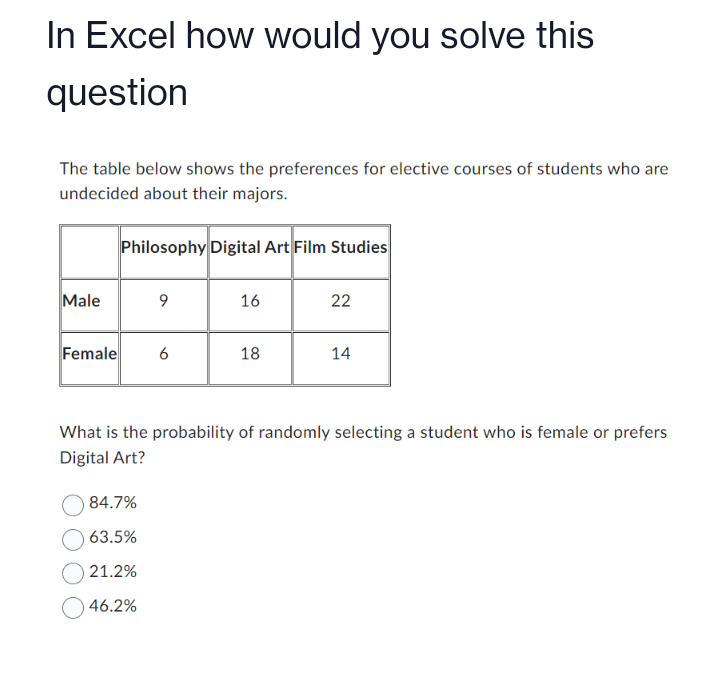
In Excel how would you solve this question The table below shows the preferences for elective courses of students who are undecided about their majors. Philosophy Digital Art Film Studies Male 9 16 22 Female 6 18 14 What is the probability of randomly selecting a student who is female or prefers Digital Art? 84.7% 63.5% 21.2% 46.2%
Step by Step Solution
There are 3 Steps involved in it
1 Expert Approved Answer
Step: 1 Unlock

Question Has Been Solved by an Expert!
Get step-by-step solutions from verified subject matter experts
Step: 2 Unlock
Step: 3 Unlock