

Question: In excel in a continuous manner please encode the following data The statistical computation should be done using ANOVA Run ANOVA I Interpret the result
In excel in a continuous manner please encode the following data
The statistical computation should be done using ANOVA
Run ANOVA I
Interpret the result
A travel industry magazine received several reports from international travelers about the quality of in-flight service on various carriers from the United States to Europe. Before writing a feature story, the magazine decided to get the services of a researcher to study the perspectives and reactions of travelers.The researcher selected passengers who had current impressions of the meal service, comfort, and friendliness of a major carrier.Three airlines were chosen and 20 passengers were selected for each airline. The respondents were requested to rate the services of the airlines.This is known as Rating 1.After sometime, the same respondents were again asked if there was an improvement in the services provided by the airline companies. This is labeled as Rating 2.The following codes were used:
Airline : 1 = Delta; 2 = Lufthansa; 3 = KLM
Class: 1 = Economy; 2 = Business
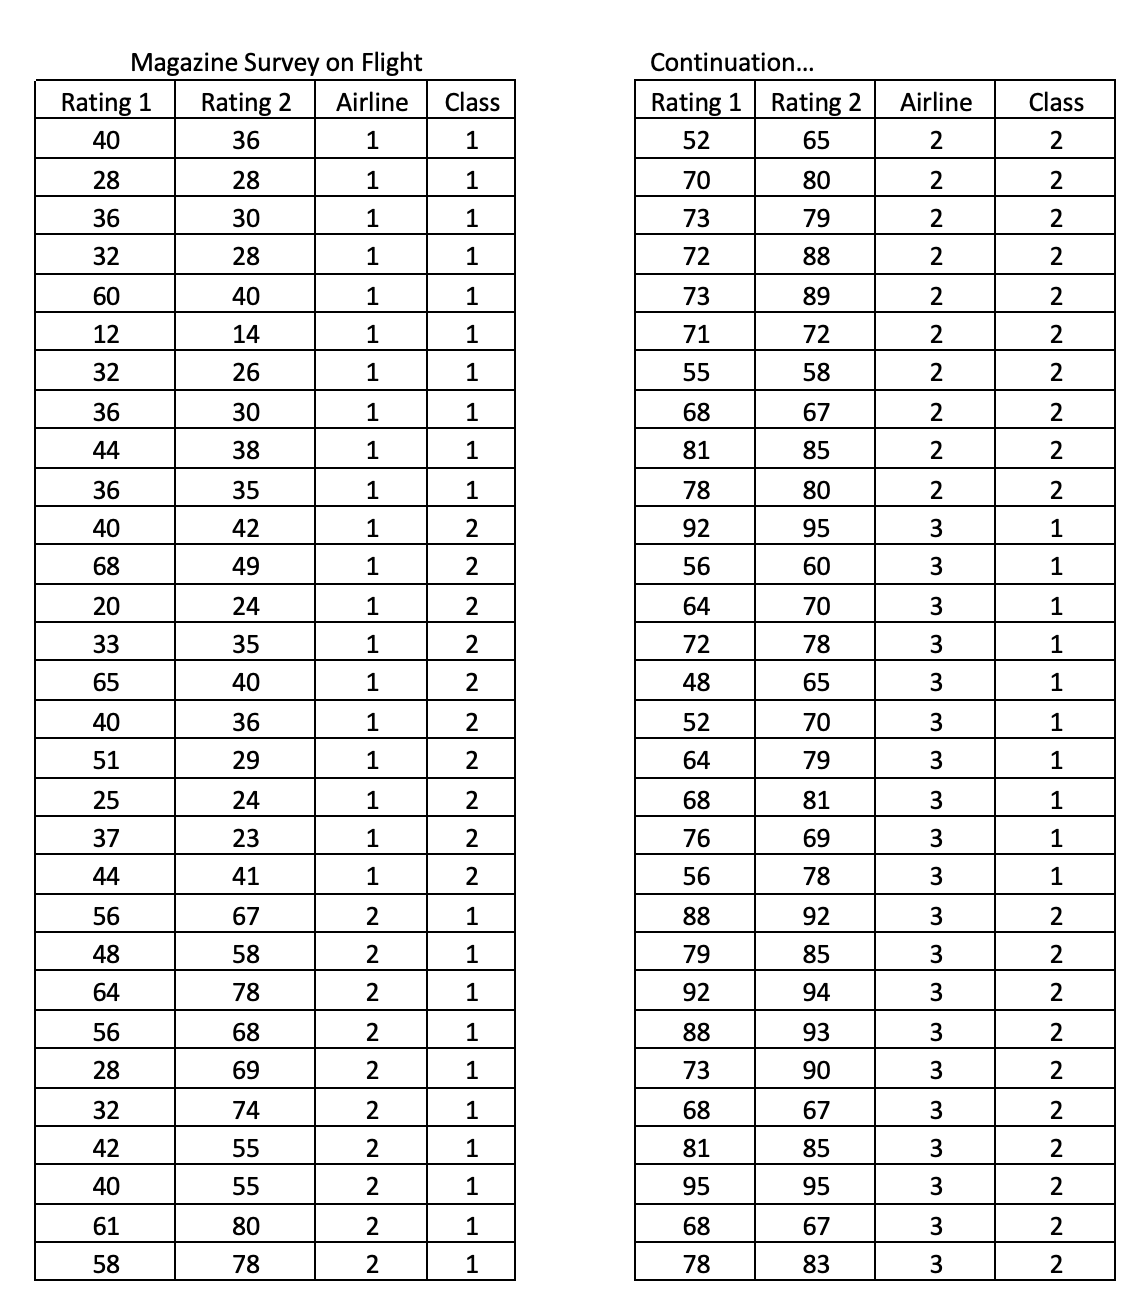
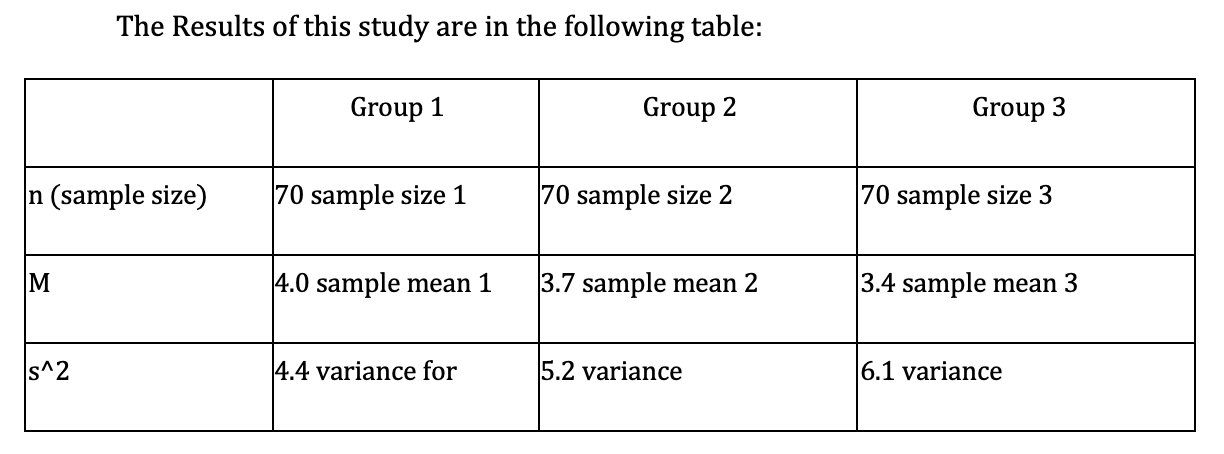
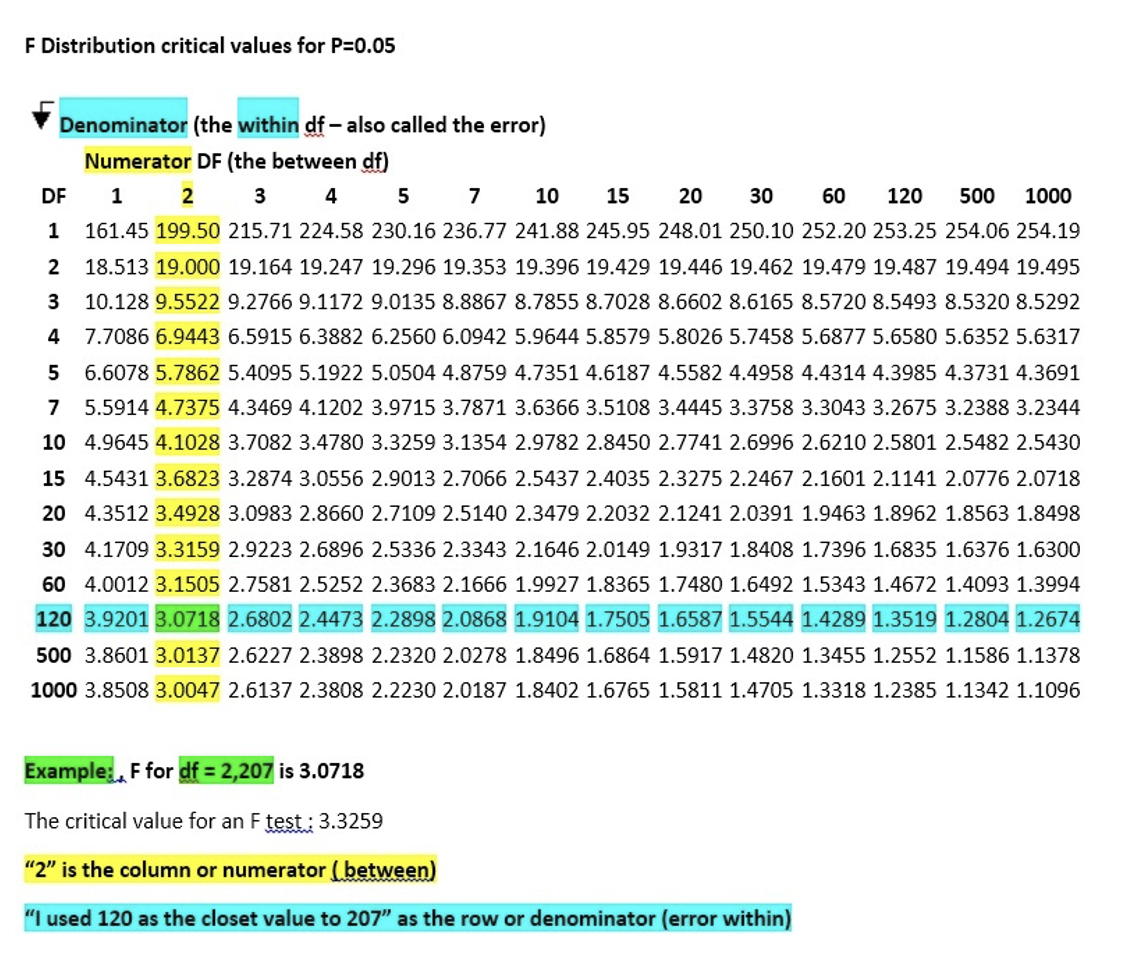
Magazine Survey on Flight Continuation... Rating 1 Rating 2 Airline Class Rating 1 Rating 2 Airline Class 40 36 1 1 52 65 2 2 28 28 1 1 70 80 IN 2 36 30 1 1 73 79 2 32 28 1 1 72 38 2 2 60 40 1 1 73 89 IN IN 12 14 1 71 72 32 26 1 1 55 58 2 NN 36 30 1 58 67 NN 44 38 81 85 36 35 78 80 W N 40 42 2 92 95 68 49 IN 56 60 W 20 24 1 2 64 70 3 33 35 IN 72 78 65 40 2 48 65 W 40 36 52 70 W INN 51 29 1 64 79 3 25 24 68 81 37 23 IN 76 69 W W 44 41 2 56 78 56 67 2 88 92 3 NNN + 48 58 79 85 64 78 NNN 92 94 w w w 56 68 88 93 UNN 28 69 2 73 90 32 74 2 58 57 42 55 2 81 85 40 55 95 95 3 N NN NN 61 80 1 58 57 W 58 78 2 1 78 33 3 NThe Results of this study are in the following table: n (sample size) 70 sample size 1 70 sample size 2 70 sample size 3 4.0 sample mean 1 3.7 sample mean 2 3.4 sample mean 3 4.4 variance for 5.2 variance 6.1 variance F Distribution critical values for P=0.05 Denominator (the within df - also called the error) Numerator DF (the between df) 1 2 3 5 7 10 15 20 30 60 120 500 1000 1 161.45 199.50 215.71 224.58 230.16 236.77 241.88 245.95 248.01 250.10 252.20 253.25 254.06 254.19 2 18.513 19.000 19.164 19.247 19.296 19.353 19.396 19.429 19.446 19.462 19.479 19.487 19.494 19.495 3 10.128 9.5522 9.2766 9.1172 9.0135 8.8867 8.7855 8.7028 8.6602 8.6165 8.5720 8.5493 8.5320 8.5292 4 7.7086 6.9443 6.5915 6.3882 6.2560 6.0942 5.9644 5.8579 5.8026 5.7458 5.6877 5.6580 5.6352 5.6317 5 6.6078 5.7862 5.4095 5.1922 5.0504 4.8759 4.7351 4.6187 4.5582 4.4958 4.4314 4.3985 4.3731 4.3691 7 5.5914 4.7375 4.3469 4.1202 3.9715 3.7871 3.6366 3.5108 3.4445 3.3758 3.3043 3.2675 3.2388 3.2344 10 4.9645 4.1028 3.7082 3.4780 3.3259 3.1354 2.9782 2.8450 2.7741 2.6996 2.6210 2.5801 2.5482 2.5430 15 4.5431 3.6823 3.2874 3.0556 2.9013 2.7066 2.5437 2.4035 2.3275 2.2467 2.1601 2.1141 2.0776 2.0718 20 4.3512 3.4928 3.0983 2.8660 2.7109 2.5140 2.3479 2.2032 2.1241 2.0391 1.9463 1.8962 1.8563 1.8498 30 4.1709 3.3159 2.9223 2.6896 2.5336 2.3343 2.1646 2.0149 1.9317 1.8408 1.7396 1.6835 1.6376 1.6300 60 4.0012 3.1505 2.7581 2.5252 2.3683 2.1666 1.9927 1.8365 1.7480 1.6492 1.5343 1.4672 1.4093 1.3994 120 3.9201 3.0718 2.6802 2.4473 2.2898 2.0868 1.9104 1.7505 1.6587 1.5544 1.4289 1.3519 1.2804 1.2674 500 3.8601 3.0137 2.6227 2.3898 2.2320 2.0278 1.8496 1.6864 1.5917 1.4820 1.3455 1.2552 1.1586 1.1378 1000 3.8508 3.0047 2.6137 2.3808 2.2230 2.0187 1.8402 1.6765 1.5811 1.4705 1.3318 1.2385 1.1342 1.1096 Example: , F for df = 2,207 is 3.0718 The critical value for an F test : 3.3259 "2" is the column or numerator ( between) "I used 120 as the closet value to 207" as the row or denominator (error within)
Step by Step Solution
There are 3 Steps involved in it

Get step-by-step solutions from verified subject matter experts