

Question: in Excel thank you! The following data represent the interarrival time (in minutes) at a service facility: 3.4 0.8 4.1 4.3 4.4 0.1 2.5 3.4
in Excel thank you!
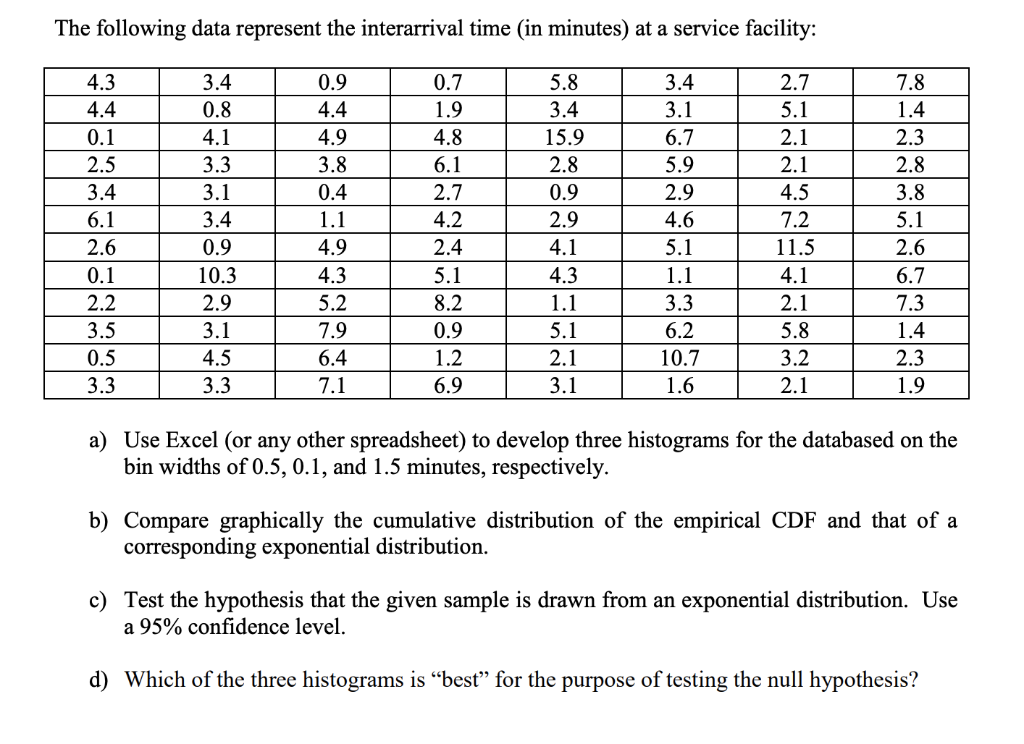
The following data represent the interarrival time (in minutes) at a service facility: 3.4 0.8 4.1 4.3 4.4 0.1 2.5 3.4 6.1 2.6 0.1 2.2 3.5 0.5 3.3 3.3 3.1 3.4 0.9 10.3 2.9 3.1 4.5 3.3 0.9 4.4 4.9 3.8 0.4 1.1 4.9 4.3 5.2 7.9 6.4 0.7 1.9 4.8 6.1 2.7 4.2 2.4 5.1 8.2 0.9 1.2 6.9 5.8 3.4 15.9 2.8 0.9 2.9 4.1 4.3 1.1 5.1 2.1 3.1 3.4 3.1 6.7 5.9 2.9 4.6 5.1 1.1 3.3 6.2 10.7 1.6 2.7 5.1 2.1 2.1 4.5 7.2 11.5 4.1 2.1 5.8 3.2 2.1 7.8 1.4 2.3 2.8 3.8 5.1 2.6 6.7 7.3 1.4 2.3 1.9 7.1 a) Use Excel (or any other spreadsheet) to develop three histograms for the databased on the bin widths of 0.5, 0.1, and 1.5 minutes, respectively. b) Compare graphically the cumulative distribution of the empirical CDF and that of a corresponding exponential distribution. c) Test the hypothesis that the given sample is drawn from an exponential distribution. Use a 95% confidence level. d) Which of the three histograms is best for the purpose of testing the null hypothesisStep by Step Solution
There are 3 Steps involved in it
1 Expert Approved Answer
Step: 1 Unlock

Question Has Been Solved by an Expert!
Get step-by-step solutions from verified subject matter experts
Step: 2 Unlock
Step: 3 Unlock