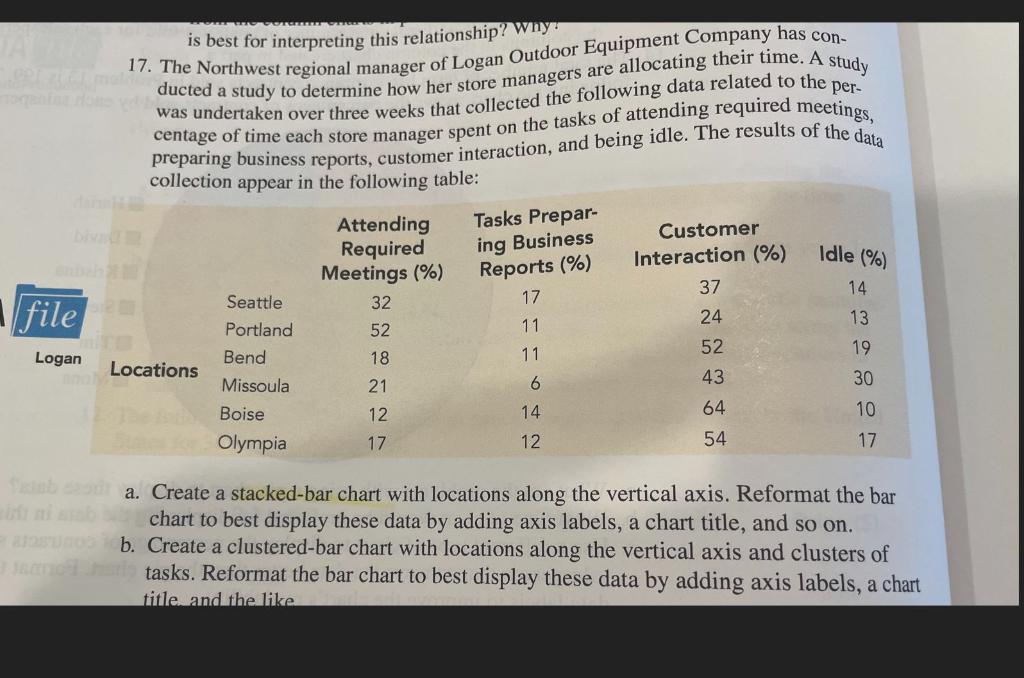
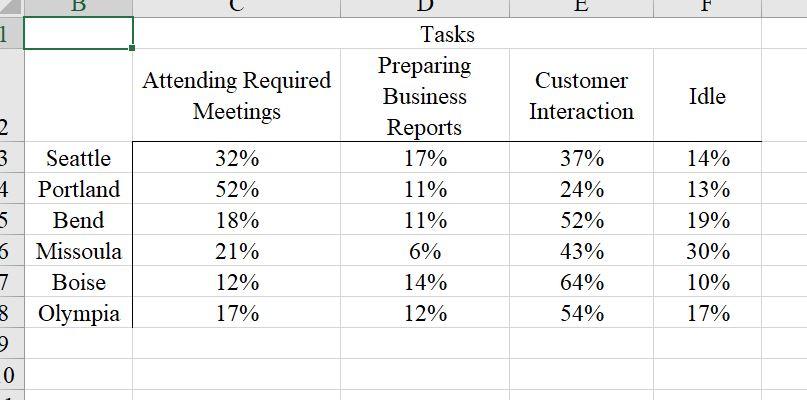
Question: In Excel using a PivotTable, please. A & B is best for interpreting this relationship? Why 17. The Northwest regional manager of Logan Outdoor Equipment

In Excel using a PivotTable, please. A & B

In Excel using a PivotTable, please. A & B is

In Excel using a PivotTable, please. A & B is

is best for interpreting this relationship? Why 17. The Northwest regional manager of Logan Outdoor Equipment Company has con- ducted a study to determine how her store managers are allocating their time. A study was undertaken over three weeks that collected the following data related to the per- preparing business reports, customer interaction, and being idle. The results of the data centage of time each store manager spent on the tasks of attending required meetings, collection appear in the following table: Attending Required Meetings (%) 32 Tasks Prepar- ing Business Reports (%) 17 Customer Interaction (%) 37 Idle (%) 14 file 24 13 52 11 52 Logan 19 11 18 Locations Seattle Portland Bend Missoula Boise Olympia 6 43 30 21 12 14 64 10 17 12 54 17 Salabod a. Create a stacked-bar chart with locations along the vertical axis. Reformat the bar chart to best display these data by adding axis labels, a chart title, and so on. b. Create a clustered-bar chart with locations along the vertical axis and clusters of tasks. Reformat the bar chart to best display these data by adding axis labels, a chart title and the like B E E F 1 Attending Required Meetings Customer Interaction Idle 2 3 Seattle 4 Portland 5 Bend 6 Missoula 7 Boise 3 Olympia 32% 52% 18% 21% 12% 17% Tasks Preparing Business Reports 17% 11% 11% 6% 14% 12% 37% 24% 52% 43% 64% 54% 14% 13% 19% 30% 10% 17% 0

Step by Step Solution

There are 3 Steps involved in it

1 Expert Approved Answer
Step: 1 Unlock blur-text-image
Question Has Been Solved by an Expert!

Get step-by-step solutions from verified subject matter experts

Step: 2 Unlock
Step: 3 Unlock

Students Have Also Explored These Related General Management Questions!