

Question: In Excel (VBA Code) Add an embedded chart to a worksheet along with a scroll bar control. Attach code to the change() event procedure of
In Excel (VBA Code) Add an embedded chart to a worksheet along with a scroll bar control. Attach code to the change() event procedure of the scroll bar control that changes the maximum value y-axis scale.
I need help after adding the embedded chart. I know how to add the scroll bar, just been trying to format the scroll bar correctly and i am not able to get it right.
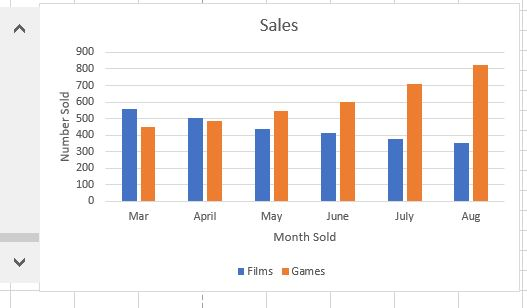
Sales 700 500 400 2300 3 100 Mar April May June July Aug Month Sold Films Games Sales 700 500 400 2300 3 100 Mar April May June July Aug Month Sold Films Games
Step by Step Solution
There are 3 Steps involved in it
1 Expert Approved Answer
Step: 1 Unlock

Question Has Been Solved by an Expert!
Get step-by-step solutions from verified subject matter experts
Step: 2 Unlock
Step: 3 Unlock