

Question: In Excel VBA Please! Thank you Initial View: Final View: Sub HW6_10 Place a control button in the worksheet SalesData Your code should work with
In Excel VBA Please! Thank you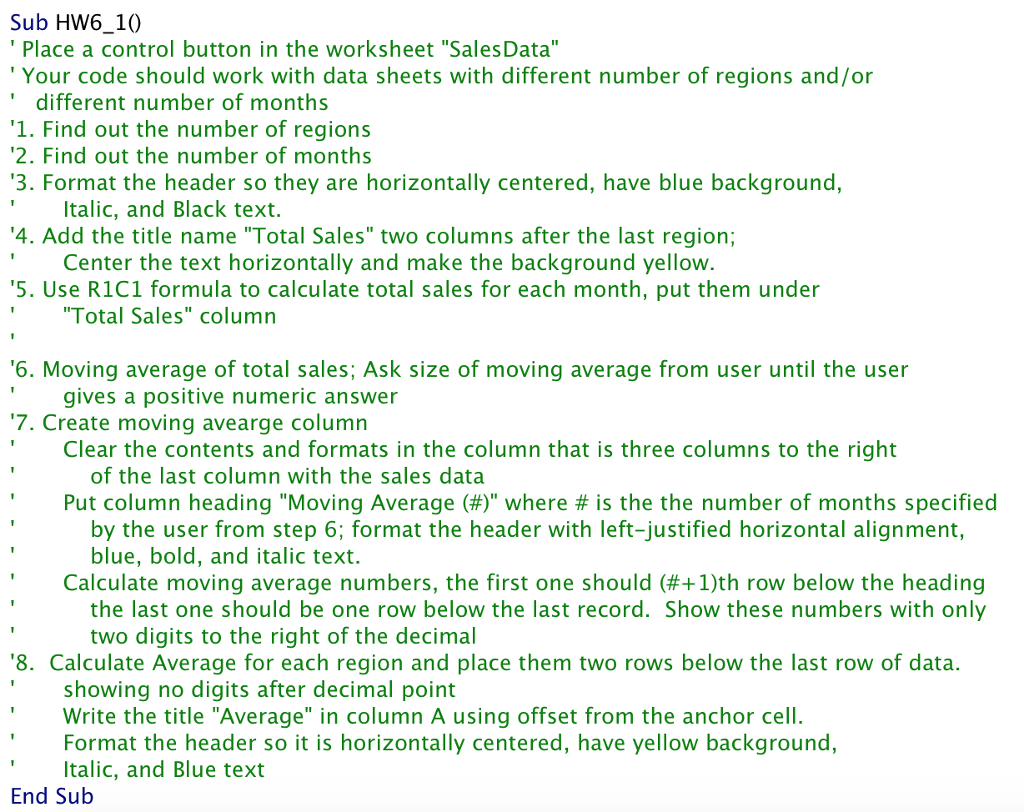
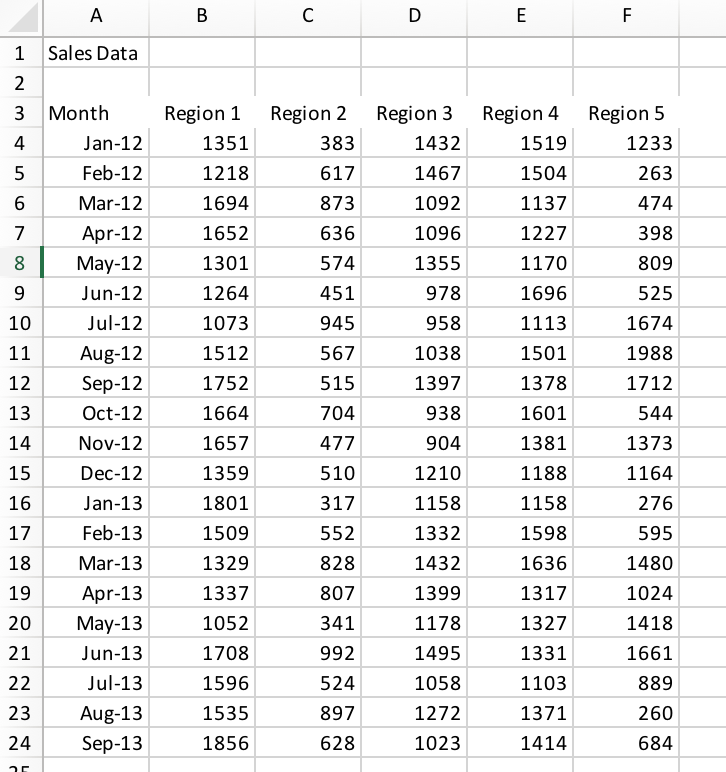
Initial View:
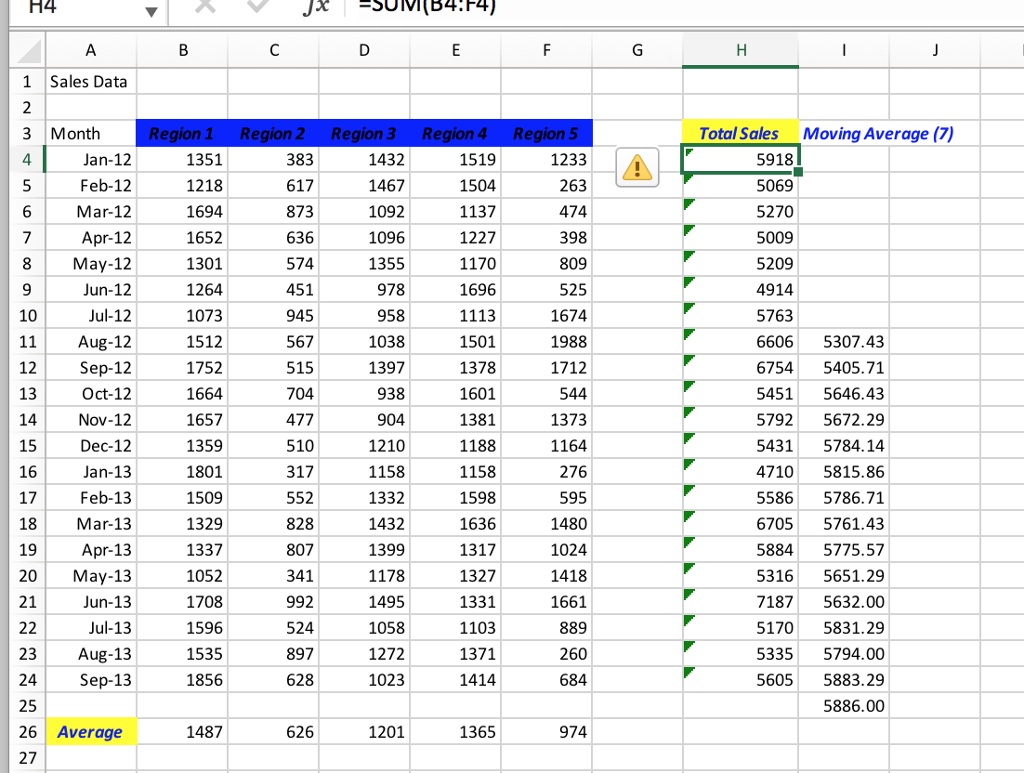
Final View:
Sub HW6_10 Place a control button in the worksheet "SalesData" Your code should work with data sheets with different number of regions and/or different number of months 1. Find out the number of regions 2. Find out the number of months 3. Format the header so they are horizontally centered, have blue background, Italic, and Black text. Center the text horizontally and make the background yellow Total Sales" column 4. Add the title name "Total Sales" two columns after the last region; 5. Use R1C1 formula to calculate total sales for each month, put them under 6. Moving average of total sales; Ask size of moving average from user until the user 7.Create moving avearge column gives a positive numeric answer Clear the contents and formats in the column that is three columns to the right of the last column with the sales data Put column heading "Moving Average (#)" where # is the the number of months specified by the user from step 6; format the header with left-justified horizontal alignment, blue, bold, and italic text. Calculate moving average numbers, the first one should (#41)th row below the heading the last one should be one row below the last record. Show these numbers with only two digits to the right of the decimal 8. Calculate Average for each region and place them two rows below the last row of data. showing no digits after decimal point Write the title "Average" in column A using offset from the anchor cell. Format the header so it is horizontally centered, have yellow background, Italic, and Blue text End Sub Sub HW6_10 Place a control button in the worksheet "SalesData" Your code should work with data sheets with different number of regions and/or different number of months 1. Find out the number of regions 2. Find out the number of months 3. Format the header so they are horizontally centered, have blue background, Italic, and Black text. Center the text horizontally and make the background yellow Total Sales" column 4. Add the title name "Total Sales" two columns after the last region; 5. Use R1C1 formula to calculate total sales for each month, put them under 6. Moving average of total sales; Ask size of moving average from user until the user 7.Create moving avearge column gives a positive numeric answer Clear the contents and formats in the column that is three columns to the right of the last column with the sales data Put column heading "Moving Average (#)" where # is the the number of months specified by the user from step 6; format the header with left-justified horizontal alignment, blue, bold, and italic text. Calculate moving average numbers, the first one should (#41)th row below the heading the last one should be one row below the last record. Show these numbers with only two digits to the right of the decimal 8. Calculate Average for each region and place them two rows below the last row of data. showing no digits after decimal point Write the title "Average" in column A using offset from the anchor cell. Format the header so it is horizontally centered, have yellow background, Italic, and Blue text End Sub
Step by Step Solution
There are 3 Steps involved in it

Get step-by-step solutions from verified subject matter experts