

Question: in excel with formula text V Draw The spreadsheet below contains the total returns for the S&P 500 Index for the years 2000-2009 in decimal
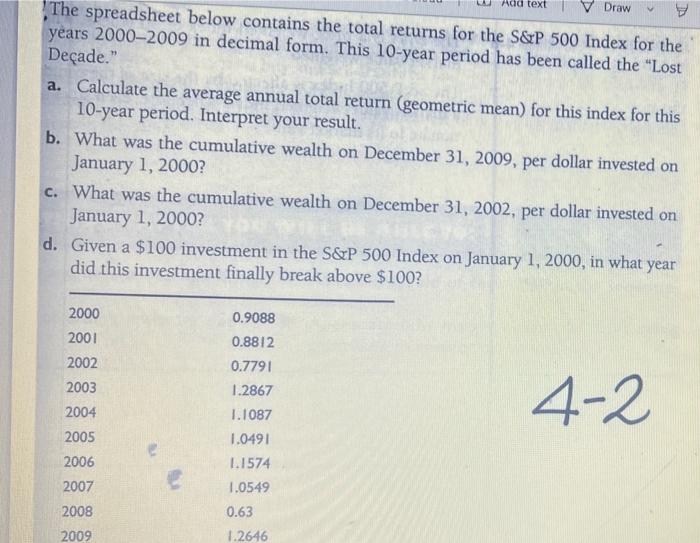
text V Draw The spreadsheet below contains the total returns for the S&P 500 Index for the years 2000-2009 in decimal form. This 10-year period has been called the "Lost Decade." a. Calculate the average annual total return (geometric mean) for this index for this 10-year period. Interpret your result. b. What was the cumulative wealth on December 31, 2009, per dollar invested on January 1, 2000? c. What was the cumulative wealth on December 31, 2002, per dollar invested on January 1, 2000? d. Given a $100 investment in the S&P 500 Index on January 1, 2000, in what year did this investment finally break above $100? 2000 2001 2002 2003 0.9088 0.8812 0.7791 1.2867 1.1087 1.0491 1.1574 1.0549 4-2 2004 2005 2006 2007 2008 0.63 2009 1.2646
Step by Step Solution
There are 3 Steps involved in it

Get step-by-step solutions from verified subject matter experts