

Question: In Figure 3 , what does A, the distance between the cost curve and P2 represent? Total Profit Profit per Unit The least efficient producer
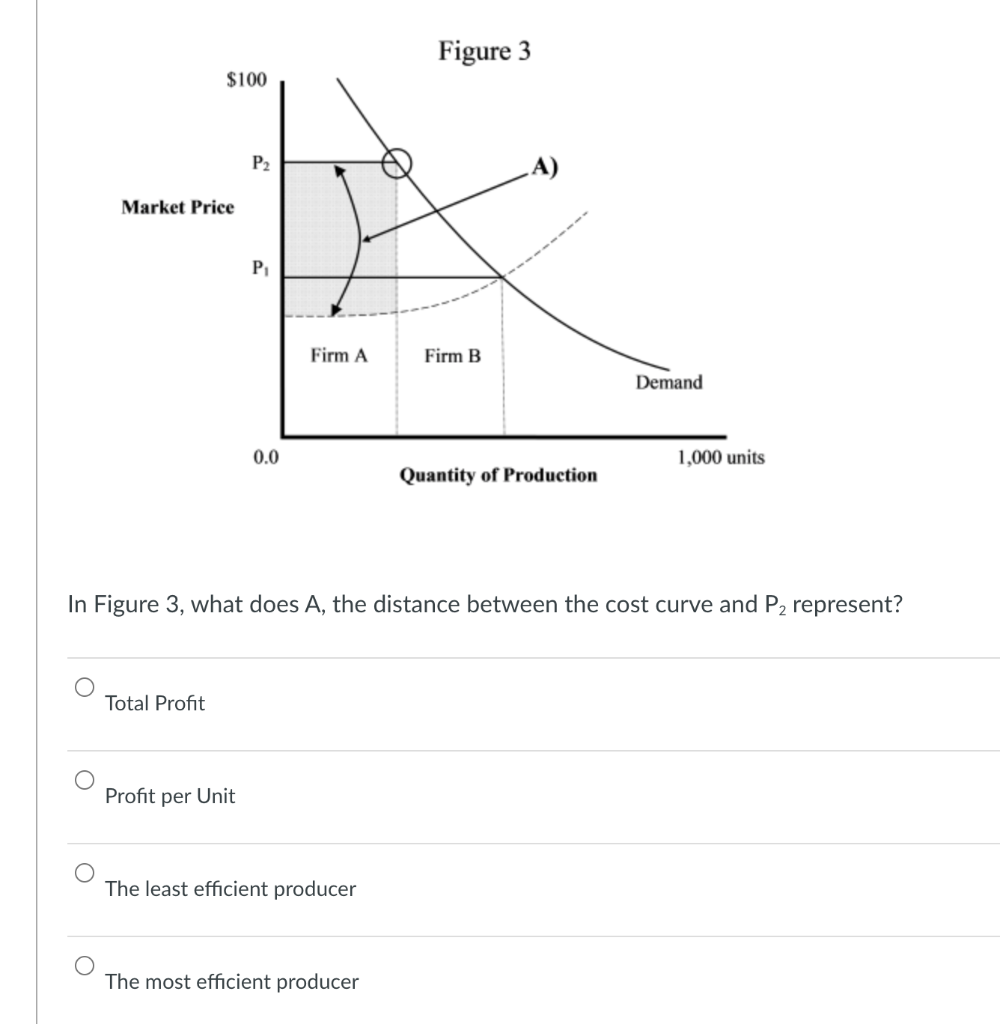
In Figure 3 , what does A, the distance between the cost curve and P2 represent? Total Profit Profit per Unit The least efficient producer The most efficient producer
Step by Step Solution
There are 3 Steps involved in it
1 Expert Approved Answer
Step: 1 Unlock

Question Has Been Solved by an Expert!
Get step-by-step solutions from verified subject matter experts
Step: 2 Unlock
Step: 3 Unlock