

Question: In general, how are data visualization techniques used to study relationship trends between two variables? How is the correlation coefficient used to get the strength
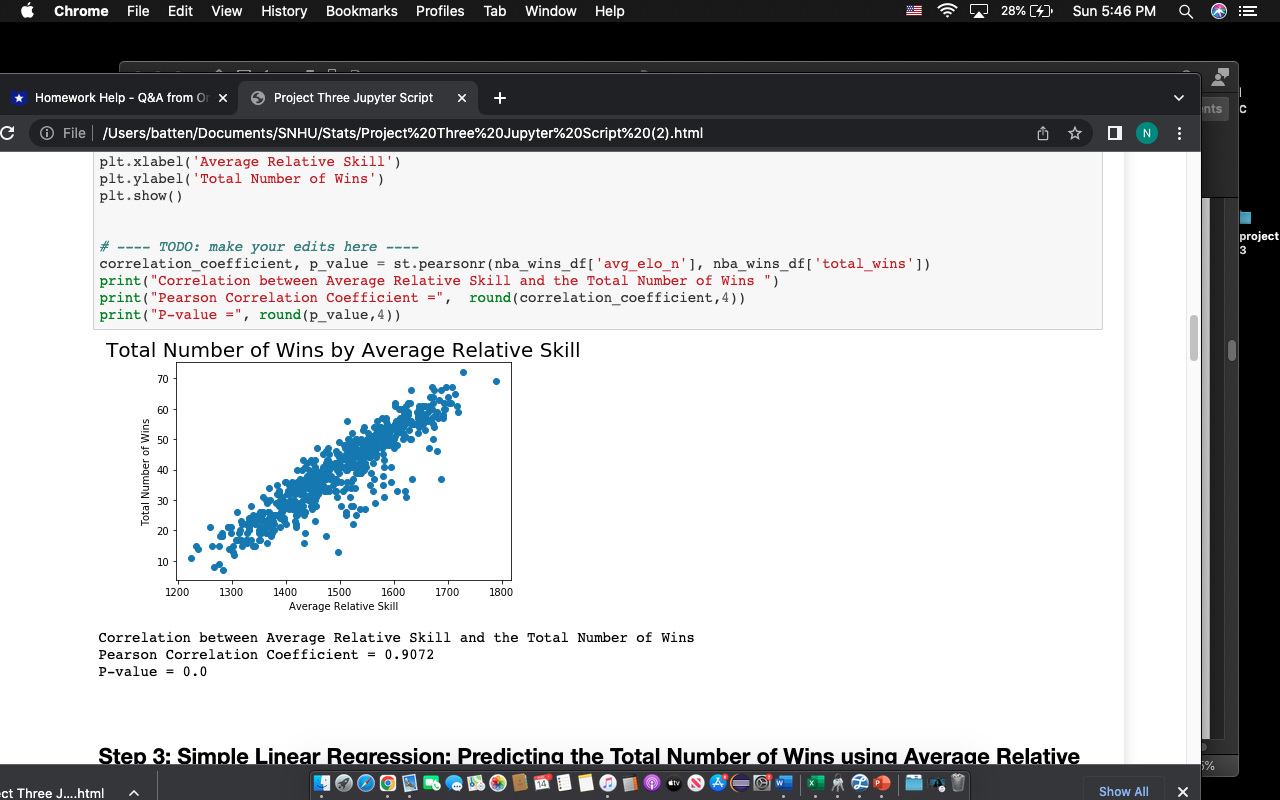
- In general, how are data visualization techniques used to study relationship trends between two variables?
- How is the correlation coefficient used to get the strength and direction of the association between two variables?
Chrome File Edit View History Bookmarks Profiles Tab Window Help 28% Sun 5:46 PM * Homework Help - Q&A from Or x
Step by Step Solution
There are 3 Steps involved in it
1 Expert Approved Answer
Step: 1 Unlock

Question Has Been Solved by an Expert!
Get step-by-step solutions from verified subject matter experts
Step: 2 Unlock
Step: 3 Unlock