

Question: in group 2. The sample statistics are in the below table. Group 1 Sample Size 16 Group 2 9 Sample Mean 20 14 Sample
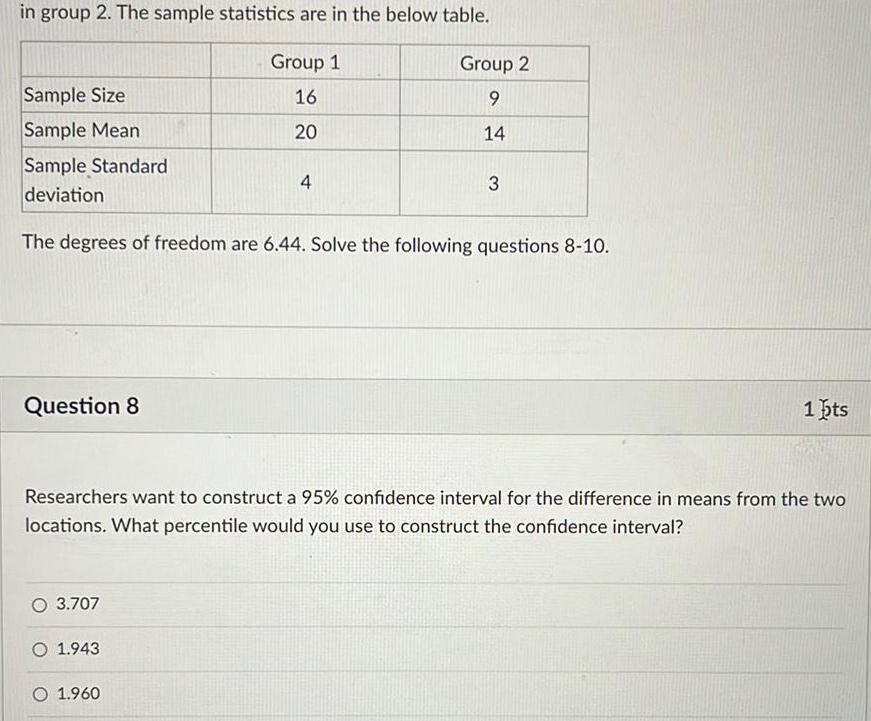
in group 2. The sample statistics are in the below table. Group 1 Sample Size 16 Group 2 9 Sample Mean 20 14 Sample Standard 4 3 deviation The degrees of freedom are 6.44. Solve the following questions 8-10. Question 8 1 pts Researchers want to construct a 95% confidence interval for the difference in means from the two locations. What percentile would you use to construct the confidence interval? 3.707 O 1.943 O 1.960
Step by Step Solution
There are 3 Steps involved in it
1 Expert Approved Answer
Step: 1 Unlock

Question Has Been Solved by an Expert!
Get step-by-step solutions from verified subject matter experts
Step: 2 Unlock
Step: 3 Unlock