

Question: In its 2016 Auto Reliability Survey, Consumer Reports asked subscribers to report their maintenance and repair costs. Most individuals are aware of the fact
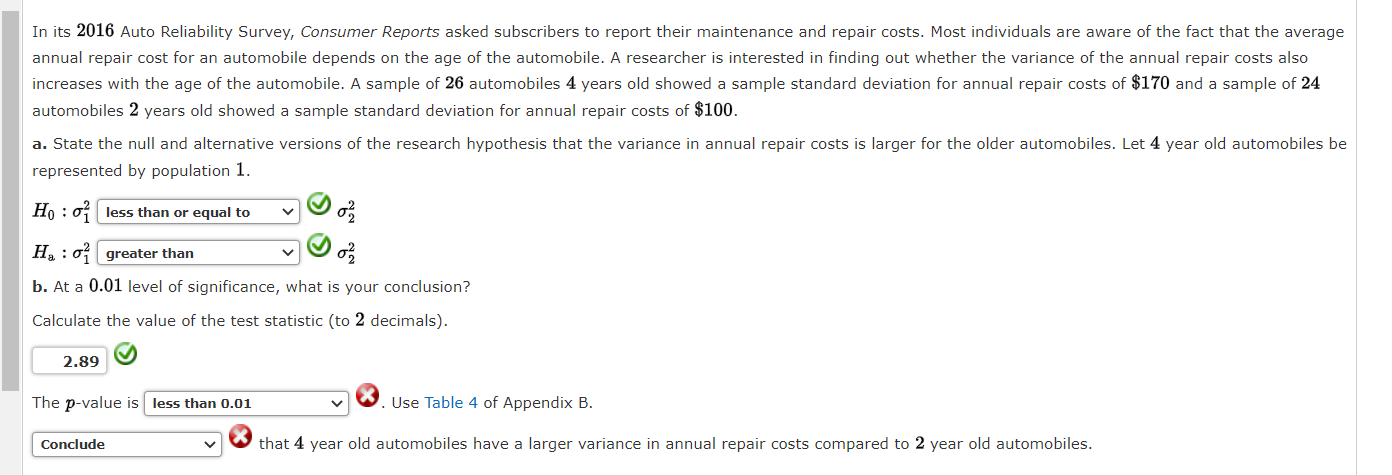
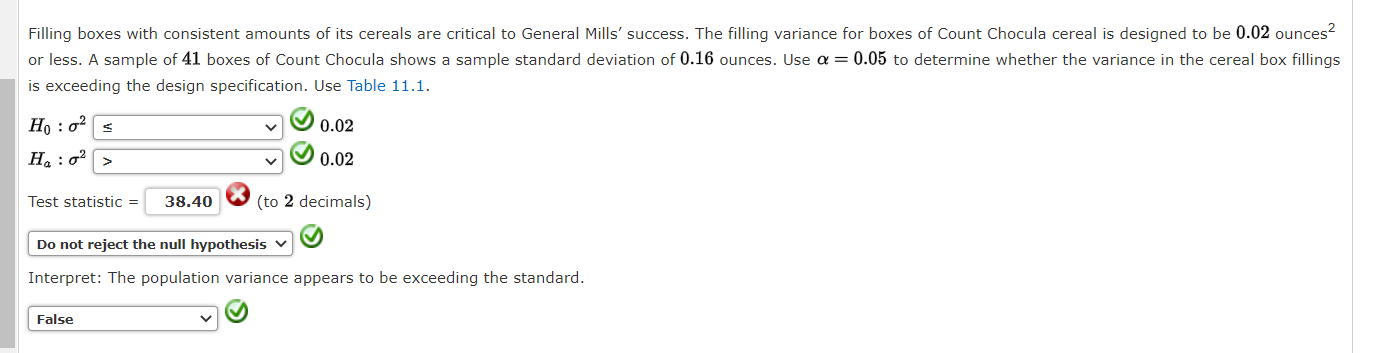
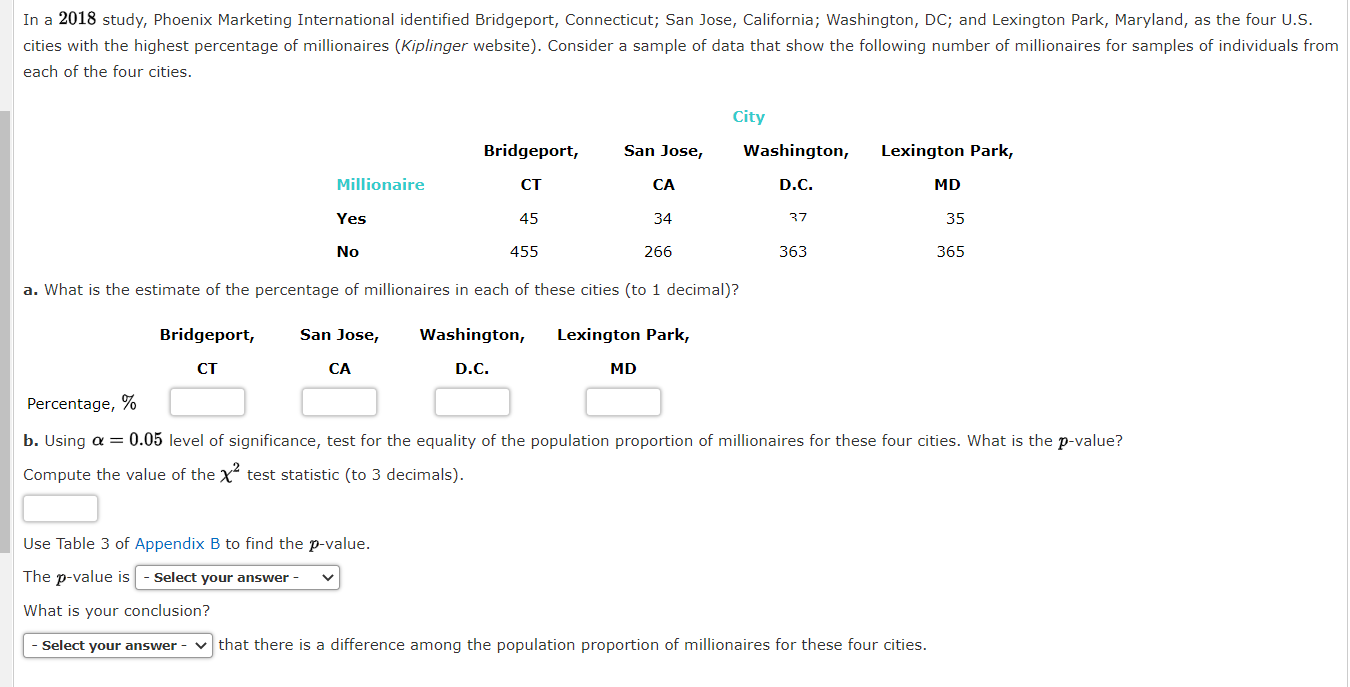
In its 2016 Auto Reliability Survey, Consumer Reports asked subscribers to report their maintenance and repair costs. Most individuals are aware of the fact that the average annual repair cost for an automobile depends on the age of the automobile. A researcher is interested in finding out whether the variance of the annual repair costs also increases with the age of the automobile. A sample of 26 automobiles 4 years old showed a sample standard deviation for annual repair costs of $170 and a sample of 24 automobiles 2 years old showed a sample standard deviation for annual repair costs of $100. a. State the null and alternative versions of the research hypothesis that the variance in annual repair costs is larger for the older automobiles. Let 4 year old automobiles be represented by population 1. Ho less than or equal to Ha greater than b. At a 0.01 level of significance, what is your conclusion? Calculate the value of the test statistic (to 2 decimals). 2.89 The p-value is less than 0.01 Conclude . Use Table 4 of Appendix B. that 4 year old automobiles have a larger variance in annual repair costs compared to 2 year old automobiles. Filling boxes with consistent amounts of its cereals are critical to General Mills' success. The filling variance for boxes of Count Chocula cereal is designed to be 0.02 ounces or less. A sample of 41 boxes of Count Chocula shows a sample standard deviation of 0.16 ounces. Use = 0.05 to determine whether the variance in the cereal box fillings is exceeding the design specification. Use Table 11.1. 0.02 0.02 Ho: 0 Ha: 0 > Test statistic = 38.40 (to 2 decimals) Do not reject the null hypothesis Interpret: The population variance appears to be exceeding the standard. False In a 2018 study, Phoenix Marketing International identified Bridgeport, Connecticut; San Jose, California; Washington, DC; and Lexington Park, Maryland, as the four U.S. cities with the highest percentage of millionaires (Kiplinger website). Consider a sample of data that show the following number of millionaires for samples of individuals from each of the four cities. Bridgeport, Millionaire CT Yes No San Jose, CA City Washington, Lexington Park, D.C. MD FTITT 45 455 34 266 a. What is the estimate of the percentage of millionaires in each of these cities (to 1 decimal)? 37 35 363 365 Bridgeport, CT San Jose, CA Percentage, % Washington, D.C. Lexington Park, MD b. Using = 0.05 level of significance, test for the equality of the population proportion of millionaires for these four cities. What is the p-value? Compute the value of the test statistic (to 3 decimals). Use Table 3 of Appendix B to find the p-value. The p-value is - Select your answer - What is your conclusion? - Select your answer that there is a difference among the population proportion of millionaires for these four cities.
Step by Step Solution
There are 3 Steps involved in it

Get step-by-step solutions from verified subject matter experts