

Question: in java Homework 06 - Compare Sorting (15 points) In class we discussed several different sorting algorithms. In this assignment you will implement two of
in java
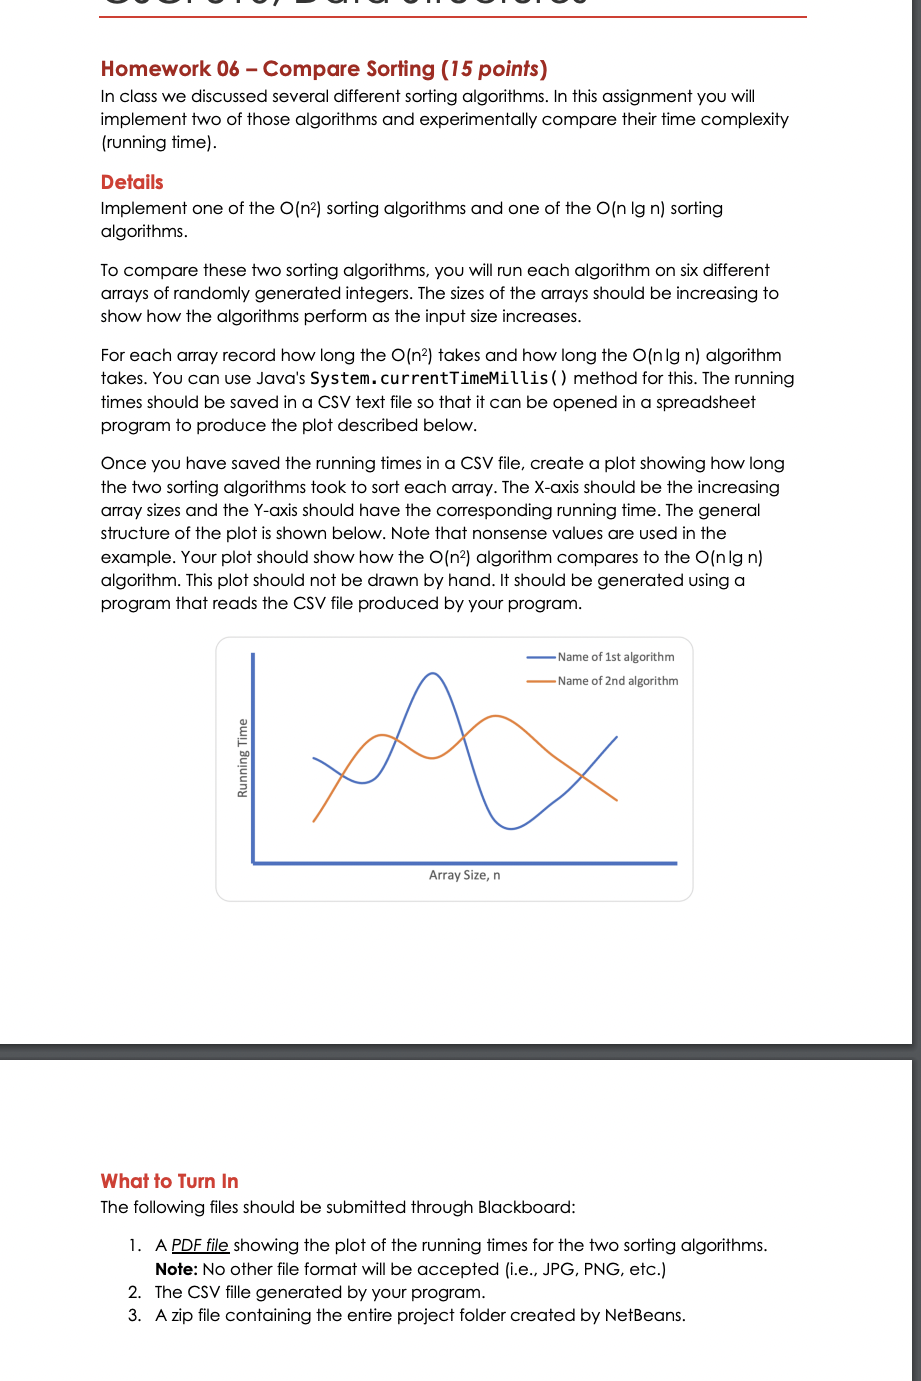
Homework 06 - Compare Sorting (15 points) In class we discussed several different sorting algorithms. In this assignment you will implement two of those algorithms and experimentally compare their time complexity (running time). Details Implement one of the O(n2) sorting algorithms and one of the O(nlgn) sorting algorithms. To compare these two sorting algorithms, you will run each algorithm on six different arrays of randomly generated integers. The sizes of the arrays should be increasing to show how the algorithms perform as the input size increases. For each array record how long the O(n2) takes and how long the O(nlgn) algorithm takes. You can use Java's System. currentTimeMillis ( ) method for this. The running times should be saved in a CSV text file so that it can be opened in a spreadsheet program to produce the plot described below. Once you have saved the running times in a CSV file, create a plot showing how long the two sorting algorithms took to sort each array. The X-axis should be the increasing array sizes and the Y-axis should have the corresponding running time. The general structure of the plot is shown below. Note that nonsense values are used in the example. Your plot should show how the O(n2) algorithm compares to the O(nlgn) algorithm. This plot should not be drawn by hand. It should be generated using a program that reads the CSV file produced by your program. What to Turn In The following files should be submitted through Blackboard: 1. A PDF file showing the plot of the running times for the two sorting algorithms. Note: No other file format will be accepted (i.e., JPG, PNG, etc.) 2. The CSV fille generated by your program. 3. A zip file containing the entire project folder created by NetBeans. Homework 06 - Compare Sorting (15 points) In class we discussed several different sorting algorithms. In this assignment you will implement two of those algorithms and experimentally compare their time complexity (running time). Details Implement one of the O(n2) sorting algorithms and one of the O(nlgn) sorting algorithms. To compare these two sorting algorithms, you will run each algorithm on six different arrays of randomly generated integers. The sizes of the arrays should be increasing to show how the algorithms perform as the input size increases. For each array record how long the O(n2) takes and how long the O(nlgn) algorithm takes. You can use Java's System. currentTimeMillis ( ) method for this. The running times should be saved in a CSV text file so that it can be opened in a spreadsheet program to produce the plot described below. Once you have saved the running times in a CSV file, create a plot showing how long the two sorting algorithms took to sort each array. The X-axis should be the increasing array sizes and the Y-axis should have the corresponding running time. The general structure of the plot is shown below. Note that nonsense values are used in the example. Your plot should show how the O(n2) algorithm compares to the O(nlgn) algorithm. This plot should not be drawn by hand. It should be generated using a program that reads the CSV file produced by your program. What to Turn In The following files should be submitted through Blackboard: 1. A PDF file showing the plot of the running times for the two sorting algorithms. Note: No other file format will be accepted (i.e., JPG, PNG, etc.) 2. The CSV fille generated by your program. 3. A zip file containing the entire project folder created by NetBeans
Step by Step Solution
There are 3 Steps involved in it

Get step-by-step solutions from verified subject matter experts