

Question: IN JAVA, please respond to questions if I have any Text: 62 4 6 -10 36 53 46 15 45 39 17 24 44 -5
IN JAVA, please respond to questions if I have any
Text:
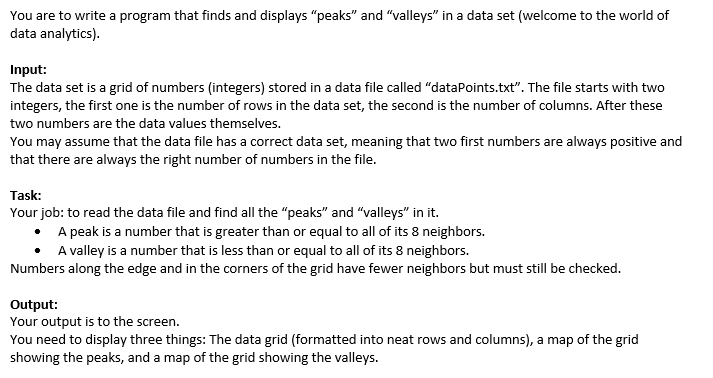
62 4 6 -10 36 53 46 15 45 39 17 24 44 -5 82 99 -3 49 79 54 -5 99 1 22 63 46 -10 -2 84 -4 52 81 60 64 -3 29 98 34 34 22 24 76 -6 13 85 98 98 49 63 42 14 65 30 94 60 52 63 98 95 10 63 78 -3 90 90 -5 99 -8 32 45 55 78 -2 81 23 68 13 10 97 93 22 -2 -2 95 95 25 37 13 12 70 56 -2 27 2 74 94 -5 78 41 70
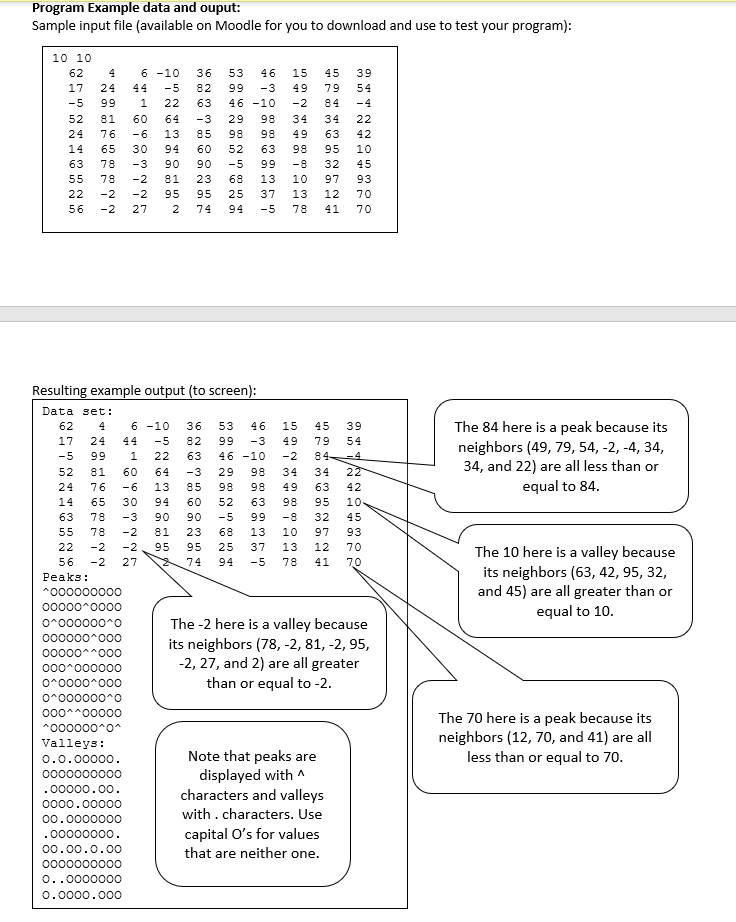
You are to write a program that finds and displays "peaks" and "valleys" in a data set (welcome to the world of data analytics). Input: The data set is a grid of numbers (integers) stored in a data file called "dataPoints.txt". The file starts with two integers, the first one is the number of rows in the data set, the second is the number of columns. After these two numbers are the data values themselves. You may assume that the data file has a correct data set, meaning that two first numbers are always positive and that there are always the right number of numbers in the file. Task: Your job: to read the data file and find all the "peaks" and "valleys" in it. A peak is a number that is greater than or equal to all of its 8 neighbors. A valley is a number that is less than or equal to all of its 8 neighbors. Numbers along the edge and in the corners of the grid have fewer neighbors but must still be checked. Output: Your output is to the screen. You need to display three things: The data grid (formatted into neat rows and columns), a map of the grid showing the peaks, and a map of the grid showing the valleys. Program Example data and ouput: Sample input file (available on Moodle for you to download and use to test your program): 4 45 39 79 10 10 62 17 24 -5 99 52 81 24 76 14 65 63 78 55 78 22 -2 56 -2 6 -10 -5 1 22 60 64 -6 13 30 94 -3 90 -2 81 -2 95 27 2 36 82 63 -3 85 60 53 46 99 -3 46 -10 29 98 98 52 63 -5 99 68 13 25 37 94 -5 15 49 -2 34 49 98 -8 10 13 78 34 63 95 32 97 12 41 54 -4 22 42 10 45 93 70 70 The 84 here is a peak because its neighbors (49, 79,54, -2,-4, 34, 34, and 22) are all less than or equal to 84. 01 NO NA The 10 here is a valley because its neighbors (63, 42, 95, 32, and 45) are all greater than or equal to 10. Resulting example output (to screen): Data set: 62 4 6 -10 36 53 46 15 45 39 17 24 -5 82 99 -3 49 79 54 -5 99 1 46 -10 -2 84 -4 52 81 64 -3 29 98 34 34 24 76 -6 13 85 98 98 49 63 42 14 65 94 60 52 63 98 95 10 63 78 90 90 -5 99 -8 32 45 55 78 -2 81 23 68 10 97 93 22 -2 -2 95 95 25 37 13 12 70 56 -2 27 2 74 94 -5 78 41 70 Peaks: 000000000 00000-0000 0-0000000 The -2 here is a valley because 000000000 00000000 its neighbors (78, -2, 81, -2, 95, 000-000000 -2, 27, and 2) are all greater 0 0000 000 than or equal to -2. 0-00000040 000400000 ^000000^0 Valleys : 0.0.00000. Note that peaks are 0000000000 displayed with .00000.00 characters and valleys 0000.00000 00.0000000 with. characters. Use 00000000 capital O's for values 00.00.0.00 that are neither one. 0000000000 0..0000000 0.0000.000 The 70 here is a peak because its neighbors (12, 70, and 41) are all less than or equal to 70
Step by Step Solution
There are 3 Steps involved in it

Get step-by-step solutions from verified subject matter experts