

Question: In Jupyter Notebook using SQL Use the CUBE and dataframe to produce a listing of total sales per department for the month of October 2012.
In Jupyter Notebook using SQL
- Use theCUBEand dataframe to produce a listing of total sales per department for the month of October 2012. The output should show the total sales for each department for each week in that month. Show the last 20 rows of dataframe.
Below is my Query but I am not sure how to set the output to show each week and the the last 20 rows of dataframe?
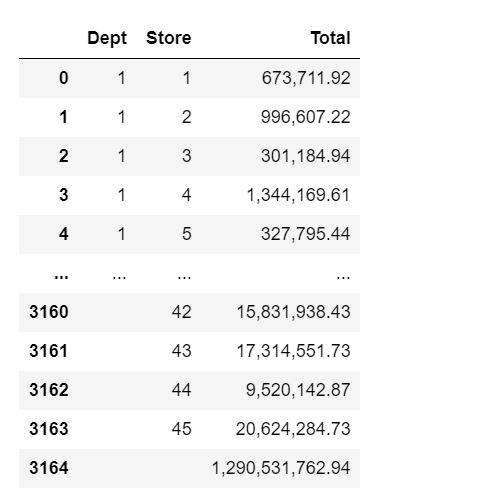
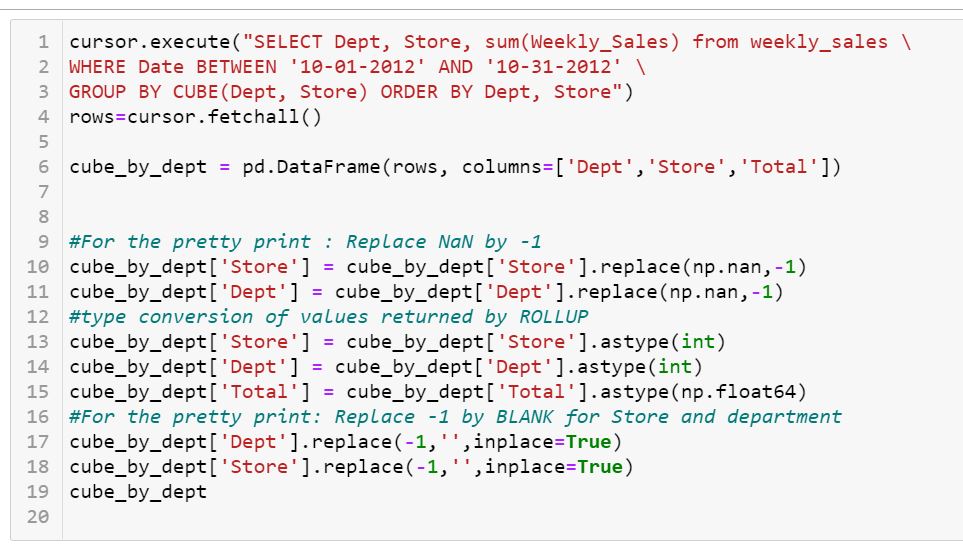
Dept Store Total O 673,711.92 2 996,607.22 2 3 301,184.94 4 1,344, 169.61 4 5 327,795.44 3160 42 15,831,938.43 3161 43 17,314,551.73 3162 44 9,520,142.87 3163 45 20,624,284.73 3164 1,290,531,762.94cursor . execute( "SELECT Dept, Store, sum(Weekly_Sales ) from weekly_sales \\ 2 WHERE Date BETWEEN '10-01-2012' AND '10-31-2012" \\ 3 GROUP BY CUBE (Dept, Store ) ORDER BY Dept, Store") 4 rows=cursor . fetchall() 5 6 cube_by_dept = pd. DataFrame (rows, columns=[ 'Dept' , 'Store' , 'Total' ]) 7 8 9 #For the pretty print : Replace Nal by -1 10 cube_by_dept [ 'Store' ] = cube_by_dept [ 'Store' ]. replace (np. nan, -1) 11 cube_by_dept [ ' Dept' ] = cube_by_dept [ ' Dept'] . replace (np. nan, -1) 12 #type conversion of values returned by ROLLUP 13 cube_by_dept[ 'Store' ] = cube_by_dept [ 'Store' ]. astype(int) 14 cube_by_dept [ ' Dept' ] = cube_by_dept[' Dept' ]. astype(int) 15 cube_by_dept [ 'Total'] = cube_by_dept[ 'Total' ]. astype(np. float64) 16 #For the pretty print: Replace -1 by BLANK for Store and department 17 cube_by_dept [ ' Dept' ] . replace( -1, ' ', inplace=True) 18 cube_by_dept [ ' Store' ] . replace (-1, '', inplace=True) 19 cube_by_dept 20
Step by Step Solution
There are 3 Steps involved in it

Get step-by-step solutions from verified subject matter experts