

Question: IN MAT MATLAB USE TEMPLATE GIVEN function project _ 1 2 ( ) % PROJECT _ 1 2 project _ 1 2 is the driver
IN MAT MATLAB USE TEMPLATE GIVEN
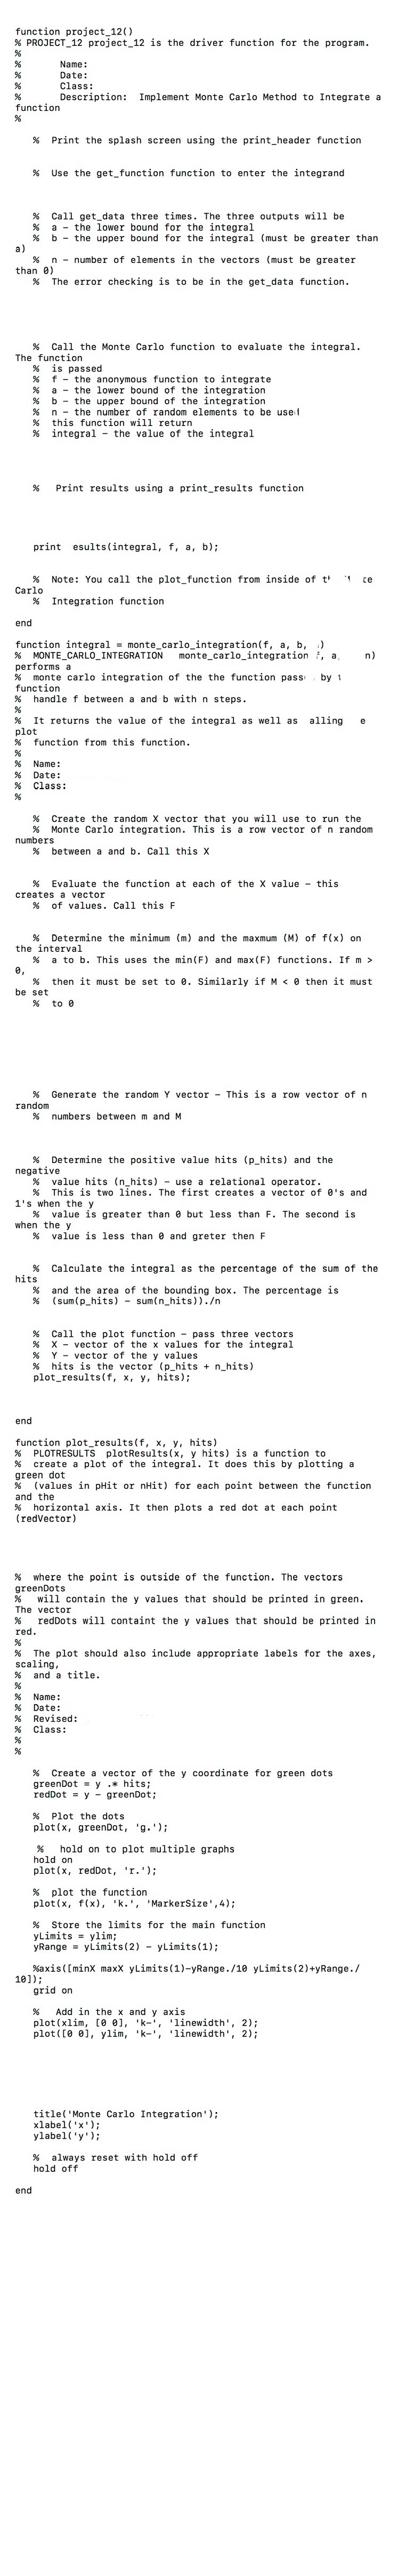
function project PROJECT project is the driver function for the program.
Name: Date: Class:
functior
Implement Monte Carlo Method to Integrate
Print the splash screen using the printheader function
Use the getfunction function to enter the integrand
Call getdata three times. The three outputs will be
Call getdata three times. The three outputs will be a the lower bound for the integral must be greater than b the upper bound for the integral must
than number of elements in the vectors must be greater
end
function plotresultsf hits PLOTRESULTS plotesults hits is a function to create a plot of the integral. It does this by plotting a create a plot of the integral. It does this by plotting a green dot values in pHit or Hit for each point between the function and the horizontal axis. It then plots a red dot at each point redvector
where the point
Objective Use simulation modeling to approximate the value of a definite integral.
Introduction In the Calculus we study integration and in particular definite integrals. With this comes many techniques for evaluating integrals. Sadly after studying substitutions, integration by parts, partial fractions, and infinite series techniques we discover that most functions simply cannot be integrated in a closed form. Instead we must opt for an approximation method to evaluate the definite integral. One such approximation technique is a Monte Carlo method. In Monte Carlo methods we use a computer to generate random numbers and then use those random numbers to approximate a mathematical model in this case a definite integral.
How does Monte Carlo integration work? The technique with which integration is presented is to calculate the area under the curve. This is usually done by fitting rectangles or other geometric shapes between the graph of the function and the axis. The areas of these shapes are then added together and the sum is an approximation of the definite integral. Monte Carlo integration works in almost the same way. The difference is that instead of shapes we will fill the area with points and count the number of points that are between the curve and the horizontal axis.
Methodology While the technique may sound a bit vague the implementation is straightforward and in MatLab it can be programmed without loops. The steps are
Have the user enter an anonymous function using the getfunction function.
Have the user enter the lower bound, and the upper bound, for the integration.
To start the Monte Carlo modeling generate a vector of random numbers for These values must be uniformly distributed between A and The MatLab command is
;
In this command is the number of random values that you would like to generate.
Now Have the program find the minimum value of the user entered function on the interval Call this scalar You can either either use the fminbnd or min functions to find the value. Since you already have a vector of input values using works well for this. There is an extra step here if is greater than zero, then must be set to zero.
Repeat this but this time have the program find the maximum value of the function on the interval Call this scalar As before, you can either either use the fminbnd or max functions. To use fminbnd you pass the negative of the function, the the function, as such it is probably easier to use the max function using your already created vector. Similarly to the minimum, if is less than zero then it must be set to zero.
These four points create a rectangle whose corners are and The area of this rectangle is
Area
Step by Step Solution
There are 3 Steps involved in it
1 Expert Approved Answer
Step: 1 Unlock

Question Has Been Solved by an Expert!
Get step-by-step solutions from verified subject matter experts
Step: 2 Unlock
Step: 3 Unlock