

Question: (in Matlab) 1. Write a Matlab script that will plot the following two functions on the same plot for the values of 0,0.5,1,1.5,...,10: y- n
(in Matlab)
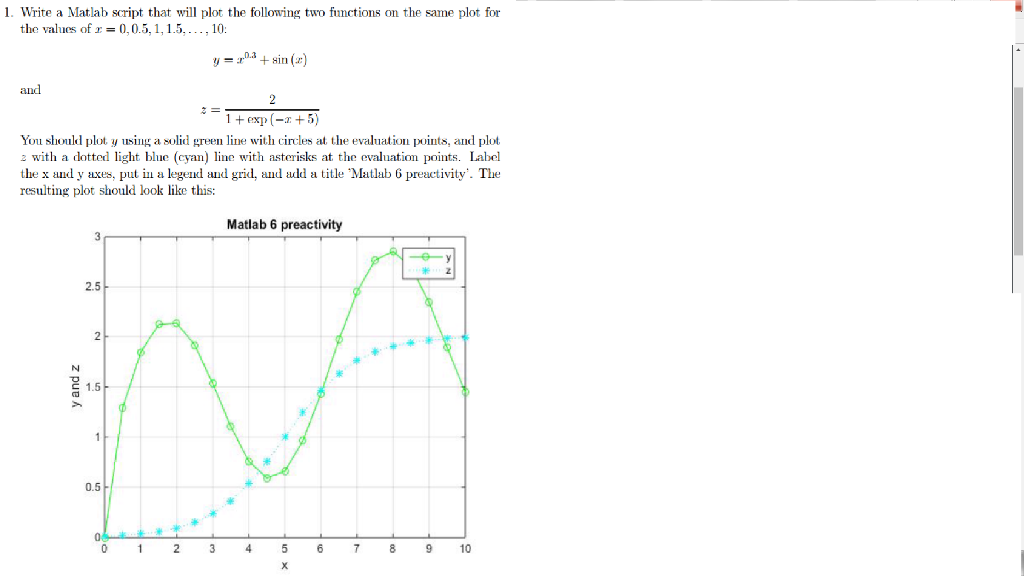
1. Write a Matlab script that will plot the following two functions on the same plot for the values of 0,0.5,1,1.5,...,10: y- n sin(r) 1 exp(z +5) You should plot y usillg a 8olid green line withircles at the evaluation points. and plot 2 with a dotted light blue (cyan) line with asterisks at the evaluation points. Label the x and y axes, put i a legend and grid, and add a title Matlab 6 preactivity. The resulting plot should look like this: Matlab 6 preactivity 2.5 0.5 0 8 9 10
Step by Step Solution
There are 3 Steps involved in it
1 Expert Approved Answer
Step: 1 Unlock

Question Has Been Solved by an Expert!
Get step-by-step solutions from verified subject matter experts
Step: 2 Unlock
Step: 3 Unlock