

Question: IN MATLAB a ) Write a function readData which will read in a file called CTEvsT. x 1 s x and will create ( and
IN MATLAB a Write a function readData which will read in a file called CTEvsT. and will create and return two
vectors, one called which corresponds to above and one vector called CTE which corresponds to the
vector above. Print the vector and CTE to the command line.
b Write another function call fitQuadraticFtn. This function will take in the and CTE vectors of data,
will set up the A matrix, the vector and solve for the coefficient vector It can be shown that the equation
for finding is given as follows:
where are the coefficients of the quadratic function that
best fit the data given. This is called a leastsquares solution and was developed by Gauss.
The function fitQuadraticFtn will return the vector of coefficients and Print these out to the
command line.
c Write a function plotQuadraticFit which takes in the original data points T and CTE vectors along with
the coefficient vector and creates a plot which shows the original data plotted as symbols such as xs and
the smooth curve fit. Use pts to create the smooth plot of the quadratic fit. The final results should look
like Figure Display the plot.
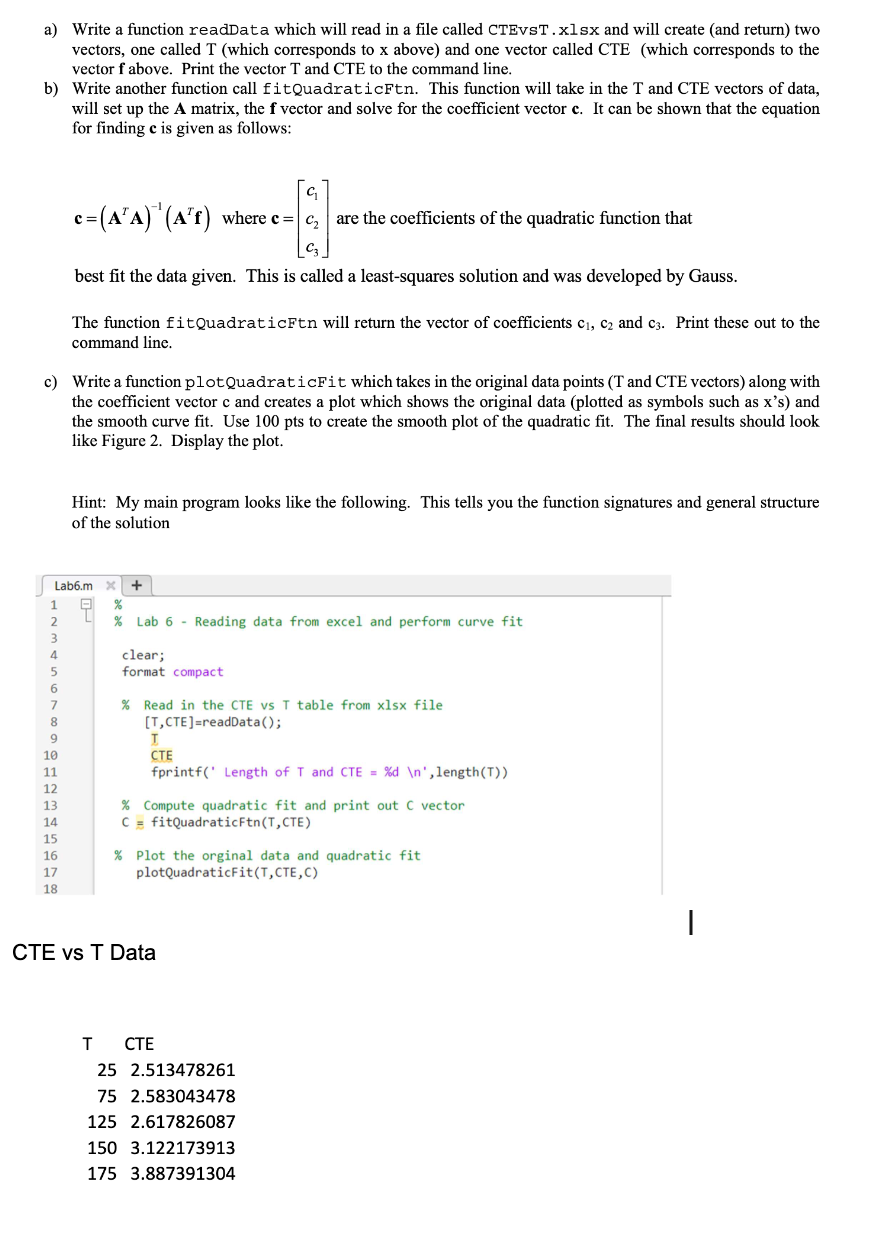
Hint: My main program looks like the following. This tells you the function signatures and general structure
of the solution
CTE vs T Data
Step by Step Solution
There are 3 Steps involved in it
1 Expert Approved Answer
Step: 1 Unlock

Question Has Been Solved by an Expert!
Get step-by-step solutions from verified subject matter experts
Step: 2 Unlock
Step: 3 Unlock