

Question: In MATLAB: Create a script that accepts a function f(x), the first derivative f ' (x), second derivative f ''(x) and stepsize h that plots
In MATLAB: Create a script that accepts a function f(x), the first derivative f ' (x), second derivative f ''(x) and stepsize h that plots the function f ' (x) (entered by user) with plots of the derivative using the forward, backward and centered difference formulas. Use the centered difference formula for the second derivative and plot this result alongside the user entered f ''(x) in a new figure.
Run this script for h = 1, 0.1, 0.01, 0.001 and the following function: f(x) = x3+ cos(x)
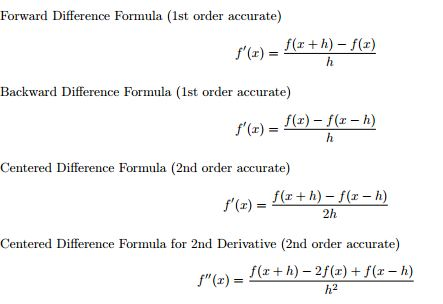
Here are the formulas needed:
Please solve using MATLAB only! Thank you.
Forward Difference Formula (1st order accurate) f(r h) -f(r) Backward Difference Formula (1st order accurate) f(r) r h) f (r) Centered Difference Formula (2nd order accurate) f (r) 2h Centered Difference Formula for 2nd Derivative (2nd order accurate f(a h) -2 (a) f( r h) f" (z) Forward Difference Formula (1st order accurate) f(r h) -f(r) Backward Difference Formula (1st order accurate) f(r) r h) f (r) Centered Difference Formula (2nd order accurate) f (r) 2h Centered Difference Formula for 2nd Derivative (2nd order accurate f(a h) -2 (a) f( r h) f" (z)
Step by Step Solution
There are 3 Steps involved in it

Get step-by-step solutions from verified subject matter experts