

Question: In Matlab Digital Comm The following example codes are provided for BPSK, need to modify it to work with QAM %bpSK_step.m Eb=1; EbN0dB=2 pause EbN0=10.^(EbN0dB/10);
In Matlab Digital Comm
The following example codes are provided for BPSK, need to modify it to work with QAM
%bpSK_step.m Eb=1; EbN0dB=2 pause
EbN0=10.^(EbN0dB/10); N0=Eb/EbN0 pause
% Monte-Carlo verification Num_of_bits=20; bits=myrandint(1,Num_of_bits,2) grid on stem(bits) axis([1 20 0 1.5]); pause
S=(2*bits-1) stem(S) axis([1 20 -1.5 1.5]); pause
N=sqrt(N0/2)*randn(1,Num_of_bits) stem(N) axis([1 20 -2 2]); pause
X=S+N stem(X) axis([1 20 -2 2]); pause
bits_decoded= (sign(X)+1)/2 stem(bits_decoded) axis([1 20 0 1.5]); pause
fprintf('compare bits with bits_decoded'); Errors_count=sum(bits-bits_decoded~=0) bits bits_decoded pause
Pe_simu=Errors_count/Num_of_bits
if 1 ==0 figure(1) stem(S) axis([1 20 -2 2]); grid on
figure(2) stem(N) axis([1 20 -2 2]); grid on
figure(3) stem(X) axis([1 20 -2 2]); grid on end
Eb=1; EbN0dB=[1:11];
% Theoretical computation for i=1:length(EbN0dB) EbN0=10.^(EbN0dB(i)/10); N0=Eb/EbN0; Pe_th(i)=Qfunc(sqrt(2*EbN0)); end
% Monte-Carlo verification Num_of_bits=10^6; bits=myrandint(1,Num_of_bits,2); % constellation points at +1, -1 S=2*bits-1;
for i=1:length(EbN0dB) EbN0=10.^(EbN0dB(i)/10); N0=Eb/EbN0;
N=sqrt(N0/2)*randn(1,Num_of_bits); X=S+N; bits_decoded= (sign(X)+1)/2; Errors_count=sum(bits-bits_decoded~=0); Pe_simu(i)=Errors_count/Num_of_bits; end
figure(1) semilogy(EbN0dB,Pe_th,'-rs'); hold on semilogy(EbN0dB,Pe_simu,'-b*'); hold on hold off set(gca,'ylim',[1e-6,1e-1]) title('Bit Error Rate for BPSK modulation'); xlabel('Eb/N0 in dB'); ylabel('Bit Error Rate'); legend('Theory','Simulation'); grid
%function y=Qfunc(x) %y=.5*erfc(x/sqrt(2));
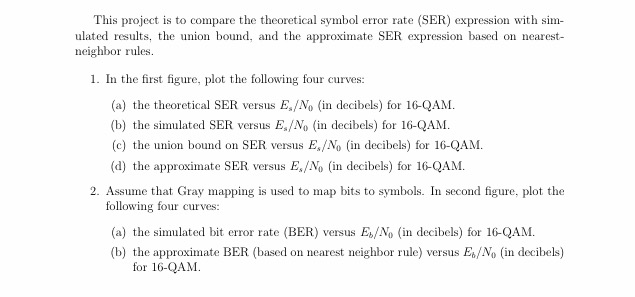
This project is to compare the theoretical symbol error rate (SER) expression with simulated results, the union bound, and the approximate SER expression based on nearest neighbor rules. In the first figure, plot the following four curves: (a) the theoretical SER versus E_s/N_0 (in decibels) for 16-QAM. (b) the simulated SER versus E_s/N_0 (in decibels) for16-QAM. (c) the union bound on SER versus E_s/N_0 (in decibels) for 16-QAM. (d) the approximate SER versus E_s/N_0 (in decibels) for 16-QAM. Assume that Gray mapping is used to map bits to symbols. In second figure, plot the following four curves: (a) the simulated bit error rate (BER) versus E_b/N_0 (in decibels) for 16-QAM. (b) the approximate BER (based on nearest neighbor rule) versus E_b/N_0 (in decibels) for 16-QAM. This project is to compare the theoretical symbol error rate (SER) expression with simulated results, the union bound, and the approximate SER expression based on nearest neighbor rules. In the first figure, plot the following four curves: (a) the theoretical SER versus E_s/N_0 (in decibels) for 16-QAM. (b) the simulated SER versus E_s/N_0 (in decibels) for16-QAM. (c) the union bound on SER versus E_s/N_0 (in decibels) for 16-QAM. (d) the approximate SER versus E_s/N_0 (in decibels) for 16-QAM. Assume that Gray mapping is used to map bits to symbols. In second figure, plot the following four curves: (a) the simulated bit error rate (BER) versus E_b/N_0 (in decibels) for 16-QAM. (b) the approximate BER (based on nearest neighbor rule) versus E_b/N_0 (in decibels) for 16-QAM
Step by Step Solution
There are 3 Steps involved in it

Get step-by-step solutions from verified subject matter experts