

Question: In MatLab. Please show full code. Thank you in advance for your time, and assistance. The stiffness curve ( line ) needs to be plotted
In MatLab. Please show full code. Thank you in advance for your time, and assistance.
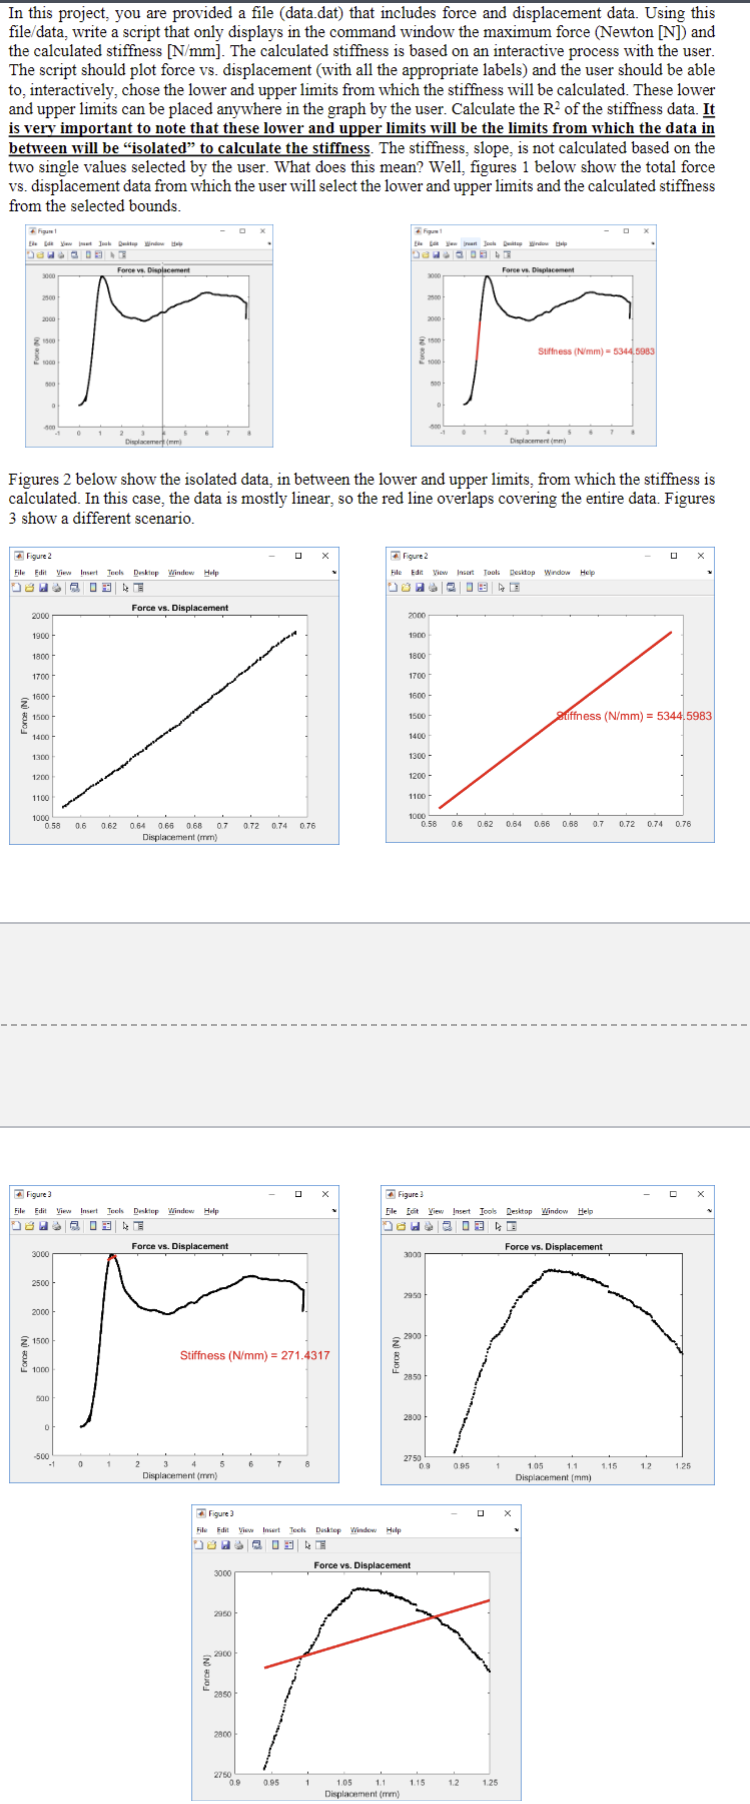
The stiffness curve line needs to be plotted on top of the original data in red.
The figure should display the Stiffness Nmm and the value in red.
Only create a plot similar to Figure
Hint: You can use commands such as ginputfind and getCursorInfo to get data point values and
information.
Step by Step Solution
There are 3 Steps involved in it
1 Expert Approved Answer
Step: 1 Unlock

Question Has Been Solved by an Expert!
Get step-by-step solutions from verified subject matter experts
Step: 2 Unlock
Step: 3 Unlock