

Question: In matlab please. The second sample maze also includes the 16 turning points which are shown as hexagrams (h) with a blue edge and yellow
 In matlab please.
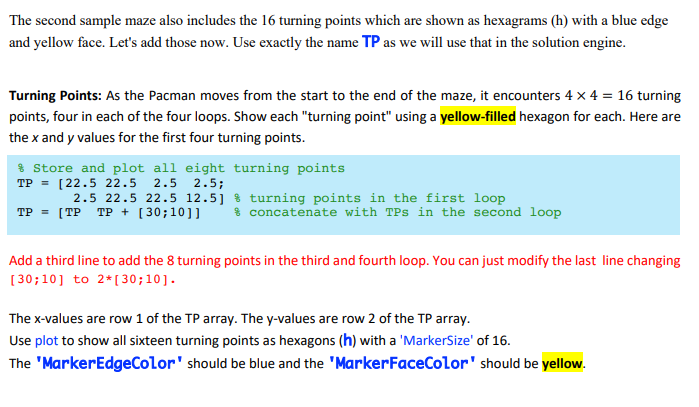
The second sample maze also includes the 16 turning points which are shown as hexagrams (h) with a blue edge and yellow face. Let's add those now. Use exactly the name TP as we will use that in the solution engine. Turning Points: As the Pacman moves from the start to the end of the maze, it encounters 4 x 4 = 16 turning points, four in each of the four loops. Show each "turning point" using a yellow-filled hexagon for each. Here are the x and y values for the first four turning points. % Store and plot all eight turning points TP = [22.5 22.5 2.5 2.5; 2.5 22.5 22.5 12.5] % turning points in the first loop TP = [TP TP + (30;10]] % concatenate with TPs in the second loop Add a third line to add the 8 turning points in the third and fourth loop. You can just modify the last line changing [30;10] to 2*[30;10). The x-values are row 1 of the TP array. The y-values are row 2 of the TP array. Use plot to show all sixteen turning points as hexagons (h) with a 'MarkerSize' of 16. The 'MarkerEdgeColor" should be blue and the 'MarkerFaceColor" should be yellow. The second sample maze also includes the 16 turning points which are shown as hexagrams (h) with a blue edge and yellow face. Let's add those now. Use exactly the name TP as we will use that in the solution engine. Turning Points: As the Pacman moves from the start to the end of the maze, it encounters 4 x 4 = 16 turning points, four in each of the four loops. Show each "turning point" using a yellow-filled hexagon for each. Here are the x and y values for the first four turning points. % Store and plot all eight turning points TP = [22.5 22.5 2.5 2.5; 2.5 22.5 22.5 12.5] % turning points in the first loop TP = [TP TP + (30;10]] % concatenate with TPs in the second loop Add a third line to add the 8 turning points in the third and fourth loop. You can just modify the last line changing [30;10] to 2*[30;10). The x-values are row 1 of the TP array. The y-values are row 2 of the TP array. Use plot to show all sixteen turning points as hexagons (h) with a 'MarkerSize' of 16. The 'MarkerEdgeColor" should be blue and the 'MarkerFaceColor" should be yellow
Step by Step Solution
There are 3 Steps involved in it

Get step-by-step solutions from verified subject matter experts