

Question: In Matlab, plot the time series data for the given data below. The first column is year, and every column after that is the months.
In Matlab, plot the time series data for the given data below. The first column is year, and every column after that is the months. The X axis will be years. Please show the code. The plot should be similar to the image attached.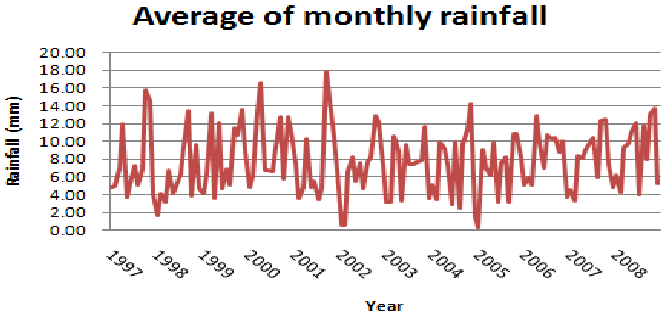
20.00 18.00 16.00 14.00 E 12.00 10.00 8.00 6.00 4.00 2.00 o.OO Average of monthly rainfall Year
Step by Step Solution
There are 3 Steps involved in it
1 Expert Approved Answer
Step: 1 Unlock

Question Has Been Solved by an Expert!
Get step-by-step solutions from verified subject matter experts
Step: 2 Unlock
Step: 3 Unlock