

Question: In Module 7, we've learned about several tests for the difference of two means, which allow us to compare two averages. A B C D
In Module 7, we've learned about several tests for the difference of two means, which allow us to compare two averages.
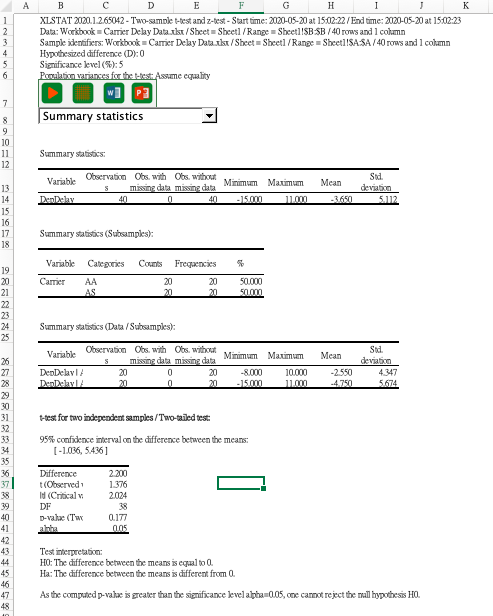
A B C D E F G H I J K XLSTAT 20120.1 2.65042 - Two-sample t-test and z-test - Start time: 2020-05-20 at 15:012:22/End time: 2020-05-20 at 15:02:23 Data: Workbook = Carrier Delay Data isx /Sheet = Sheetl / Range = Sheet1/SB-$B /40 rows and I column Sample identifiers: Workbook = Carrier Delay Data xiax / Sheet = Sheetl / Range = Sheet1/SASA/40 rows and I column Hypothesized difference (D): Q Significance level($):5 Formation variances fotheel-fest: Assume equality w ] Summary statistics Summary statistics: 12 13 Variable Observation Ots. with Ots. without meanE dala missing data Minimum Maximum Mean deviation 14 40 40 -15 00) 11020 -3.650 5.112 15 Summary statistics (Subsamples): 18 19 Variable Categories Counts Frequencies Carrier AA 20 50.000 AS 20 20 24 Summary statistics (Data / Subsamples): 25 Variable Observation Obs with Obs without Sid 26 mesing Gala MEsing data Minimum Maximum Mean 27 DenDelay 1 / 20 20 -800 10 07 2.550 1 347 28 20 20 -15020 11000 -4 720 5 674 t-test for two independent samples / Two-tailed test: 95% confidence interval on the difference between the means. [-1 036, 5.436] 36 Difference 2.200 10Observed 1.376 Id (Critical w 2 024 DF 38 D-value (Tax 0.177 005 Test interpretation: HQ: The difference between the means is equal to (1. 45 Ha: The difference between the means is different from (. 46 47 As the computed p-value is greater than the significance level alpha=0105, one cannot reject the null hypothesis H
Step by Step Solution
There are 3 Steps involved in it

Get step-by-step solutions from verified subject matter experts