

Question: -risk ratios and confounding-that are important in epidemiology for studying the health effects of exposure to drugs. A risk ratio (or relative risk) tells
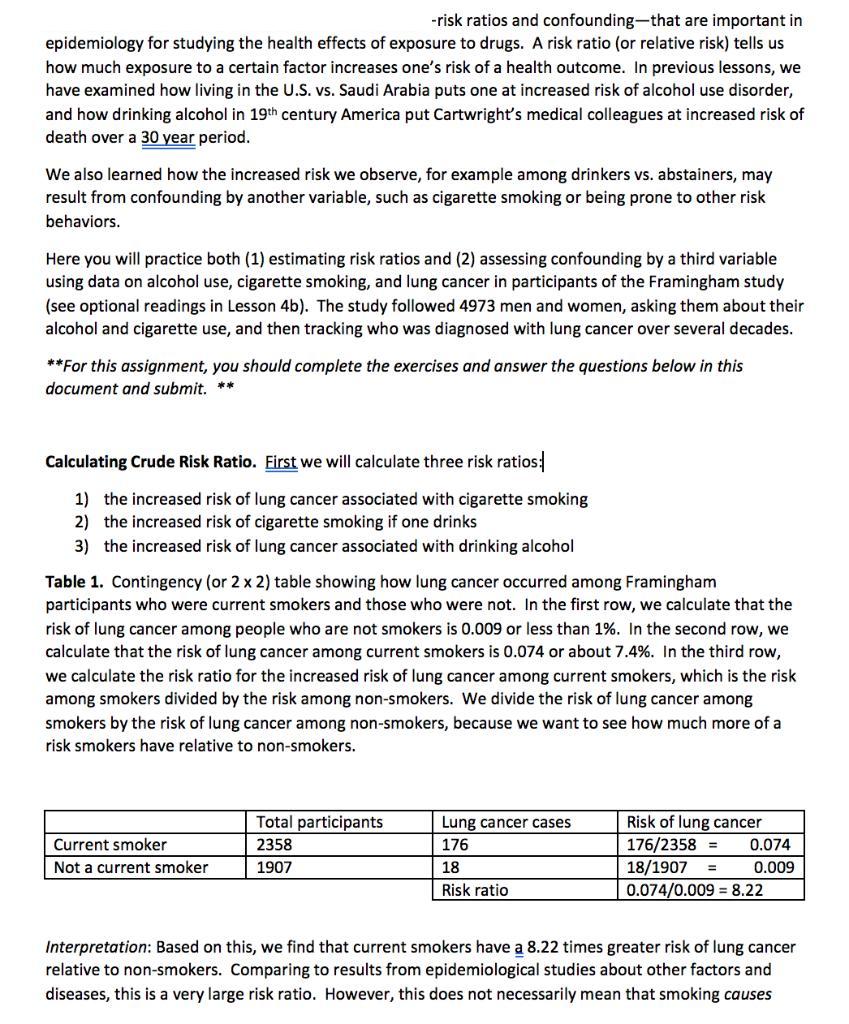
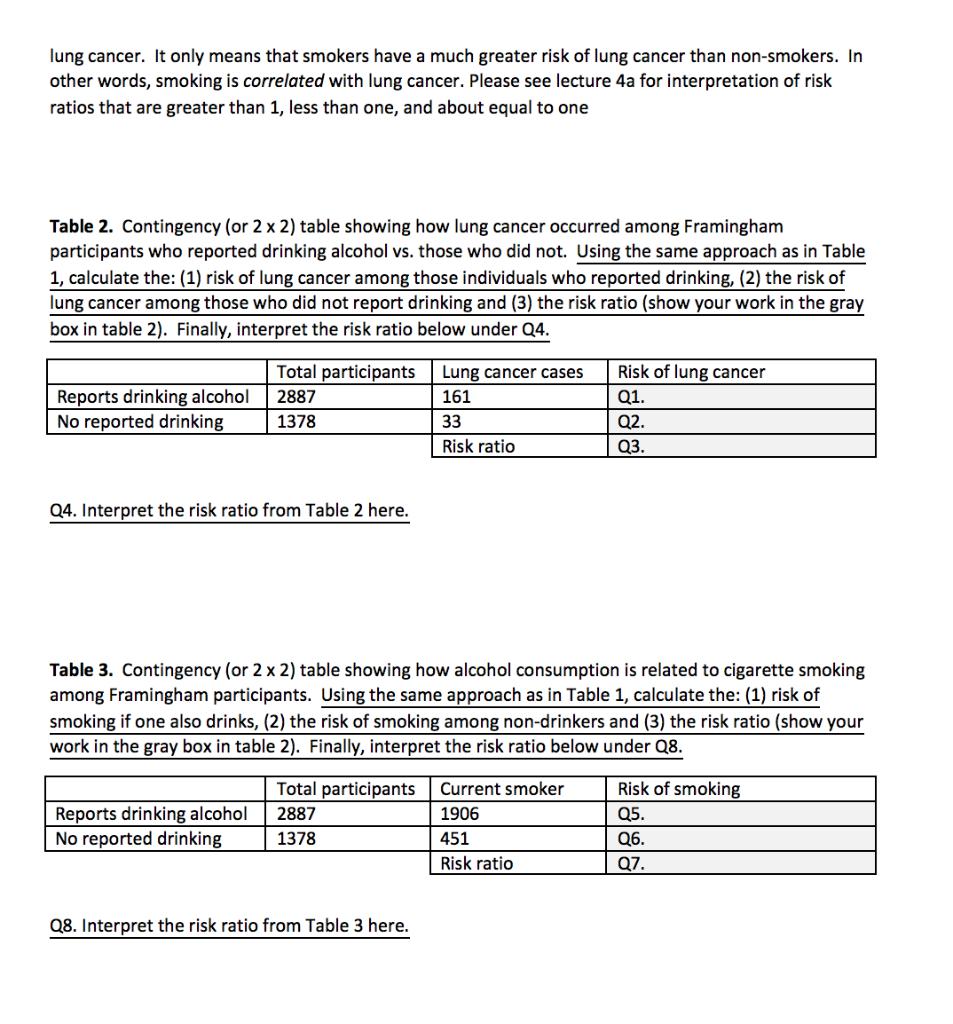
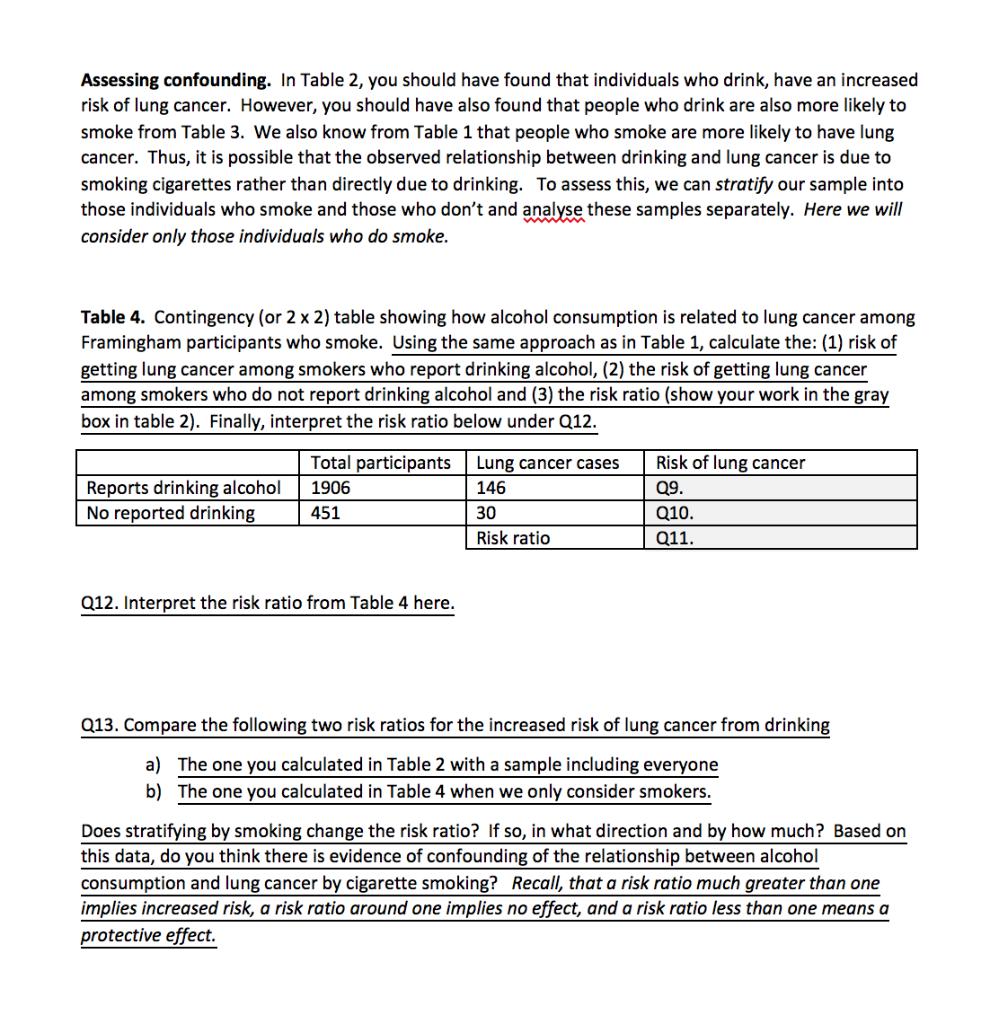
-risk ratios and confounding-that are important in epidemiology for studying the health effects of exposure to drugs. A risk ratio (or relative risk) tells us how much exposure to a certain factor increases one's risk of a health outcome. In previous lessons, we have examined how living in the U.S. vs. Saudi Arabia puts one at increased risk of alcohol use disorder, and how drinking alcohol in 19th century America put Cartwright's medical colleagues at increased risk of death over a 30 year period. We also learned how the increased risk we observe, for example among drinkers vs. abstainers, may result from confounding by another variable, such as cigarette smoking or being prone to other risk behaviors. Here you will practice both (1) estimating risk ratios and (2) assessing confounding by a third variable using data on alcohol use, cigarette smoking, and lung cancer in participants of the Framingham study (see optional readings in Lesson 4b). The study followed 4973 men and women, asking them about their alcohol and cigarette use, and then tracking who was diagnosed with lung cancer over several decades. **For this assignment, you should complete the exercises and answer the questions below in this document and submit. ** Calculating Crude Risk Ratio. First we will calculate three risk ratios: 1) the increased risk of lung cancer associated with cigarette smoking 2) the increased risk of cigarette smoking if one drinks 3) the increased risk of lung cancer associated with drinking alcohol Table 1. Contingency (or 2 x 2) table showing how lung cancer occurred among Framingham participants who were current smokers and those who were not. In the first row, we calculate that the risk of lung cancer among people who are not smokers is 0.009 or less than 1%. In the second row, we calculate that the risk of lung cancer among current smokers is 0.074 or about 7.4%. In the third row, we calculate the risk ratio for the increased risk of lung cancer among current smokers, which is the risk among smokers divided by the risk among non-smokers. We divide the risk of lung cancer among smokers by the risk of lung cancer among non-smokers, because we want to see how much more of a risk smokers have relative to non-smokers. Current smoker Not a current smoker Total participants 2358 1907 Lung cancer cases 176 18 Risk ratio Risk of lung cancer 176/2358 = 0.074 18/1907 0.009 0.074/0.0098.22 Interpretation: Based on this, we find that current smokers have a 8.22 times greater risk of lung cancer relative to non-smokers. Comparing to results from epidemiological studies about other factors and diseases, this is a very large risk ratio. However, this does not necessarily mean that smoking causes lung cancer. It only means that smokers have a much greater risk of lung cancer than non-smokers. In other words, smoking is correlated with lung cancer. Please see lecture 4a for interpretation of risk ratios that are greater than 1, less than one, and about equal to one Table 2. Contingency (or 2 x 2) table showing how lung cancer occurred among Framingham participants who reported drinking alcohol vs. those who did not. Using the same approach as in Table 1, calculate the: (1) risk of lung cancer among those individuals who reported drinking, (2) the risk of lung cancer among those who did not report drinking and (3) the risk ratio (show your work in the gray box in table 2). Finally, interpret the risk ratio below under Q4. Reports drinking alcohol No reported drinking Total participants 2887 1378 Q4. Interpret the risk ratio from Table 2 here. Reports drinking alcohol No reported drinking Table 3. Contingency (or 2 x 2) table showing how alcohol consumption is related to cigarette smoking among Framingham participants. Using the same approach as in Table 1, calculate the: (1) risk of smoking if one also drinks, (2) the risk of smoking among non-drinkers and (3) the risk ratio (show your work in the gray box in table 2). Finally, interpret the risk ratio below under Q8. Total participants 2887 1378 Lung cancer cases 161 33 Risk ratio Q8. Interpret the risk ratio from Table 3 here. Risk of lung cancer Q1. Q2. Q3. Current smoker 1906 451 Risk ratio Risk of smoking Q5. Q6. Q7. Assessing confounding. In Table 2, you should have found that individuals who drink, have an increased risk of lung cancer. However, you should have also found that people who drink are also more likely to smoke from Table 3. We also know from Table 1 that people who smoke are more likely to have lung cancer. Thus, it is possible that the observed relationship between drinking and lung cancer is due to smoking cigarettes rather than directly due to drinking. To assess this, we can stratify our sample into those individuals who smoke and those who don't and analyse these samples separately. Here we will consider only those individuals who do smoke. Table 4. Contingency (or 2 x 2) table showing how alcohol consumption is related to lung cancer among Framingham participants who smoke. Using the same approach as in Table 1, calculate the: (1) risk of getting lung cancer among smokers who report drinking alcohol, (2) the risk of getting lung cancer among smokers who do not report drinking alcohol and (3) the risk ratio (show your work in the gray box in table 2). Finally, interpret the risk ratio below under Q12. Reports drinking alcohol No reported drinking Total participants 1906 451 Q12. Interpret the risk ratio from Table 4 here. Lung cancer cases. 146 30 Risk ratio Risk of lung cancer Q9. Q10. Q11. Q13. Compare the following two risk ratios for the increased risk of lung cancer from drinking a) The one you calculated in Table 2 with a sample including everyone b) The one you calculated in Table 4 when we only consider smokers. Does stratifying by smoking change the risk ratio? If so, in what direction and by how much? Based on this data, do you think there is evidence of confounding of the relationship between alcohol consumption and lung cancer by cigarette smoking? Recall, that a risk ratio much greater than one implies increased risk, a risk ratio around one implies no effect, and a risk ratio less than one means a protective effect.
Step by Step Solution
3.54 Rating (189 Votes )
There are 3 Steps involved in it
Table 2 Risk of Lung Cancer among Those Who Drink vs Those Who Dont Given data Lung Cancer Cases among Drinkers 161 Total Drinkers 2887 Lung Cancer Cases among NonDrinkers 33 Total NonDrinkers 1378 1 ... View full answer

Get step-by-step solutions from verified subject matter experts