

Question: In my math class they show us a graph which shows three different exponential growth or decay functions. Each graph has ay-intercept of 8 .
In my math class they show us a graph which shows three different exponential growth or decay functions.
Each graph has ay-intercept of 8 .
One function shows the exponential growth of a bacteria that has a growth rate of _0.06___ in thousands.
Another function shows a__2 percent__increase in the population of a species, in thousands.
The third function shows a chemical compound, in thousands of grams, with a half-life of about11.55years.
They then ask us What graph represents each of those situations. and what is the population or mass of the item in10years. and What is the equation for each function.
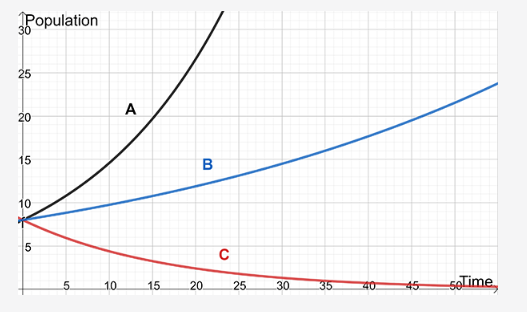
30 Population 25 20 A 15 B 10 5 C 10 15 20 25 30 35 40 45 soTime
Step by Step Solution
There are 3 Steps involved in it

Get step-by-step solutions from verified subject matter experts