

Question: In my statistics class we are using google sheets to solve problems like this. So hopefully I can still get the answers to this because
In my statistics class we are using google sheets to solve problems like this. So hopefully I can still get the answers to this because I'm struggling to understand
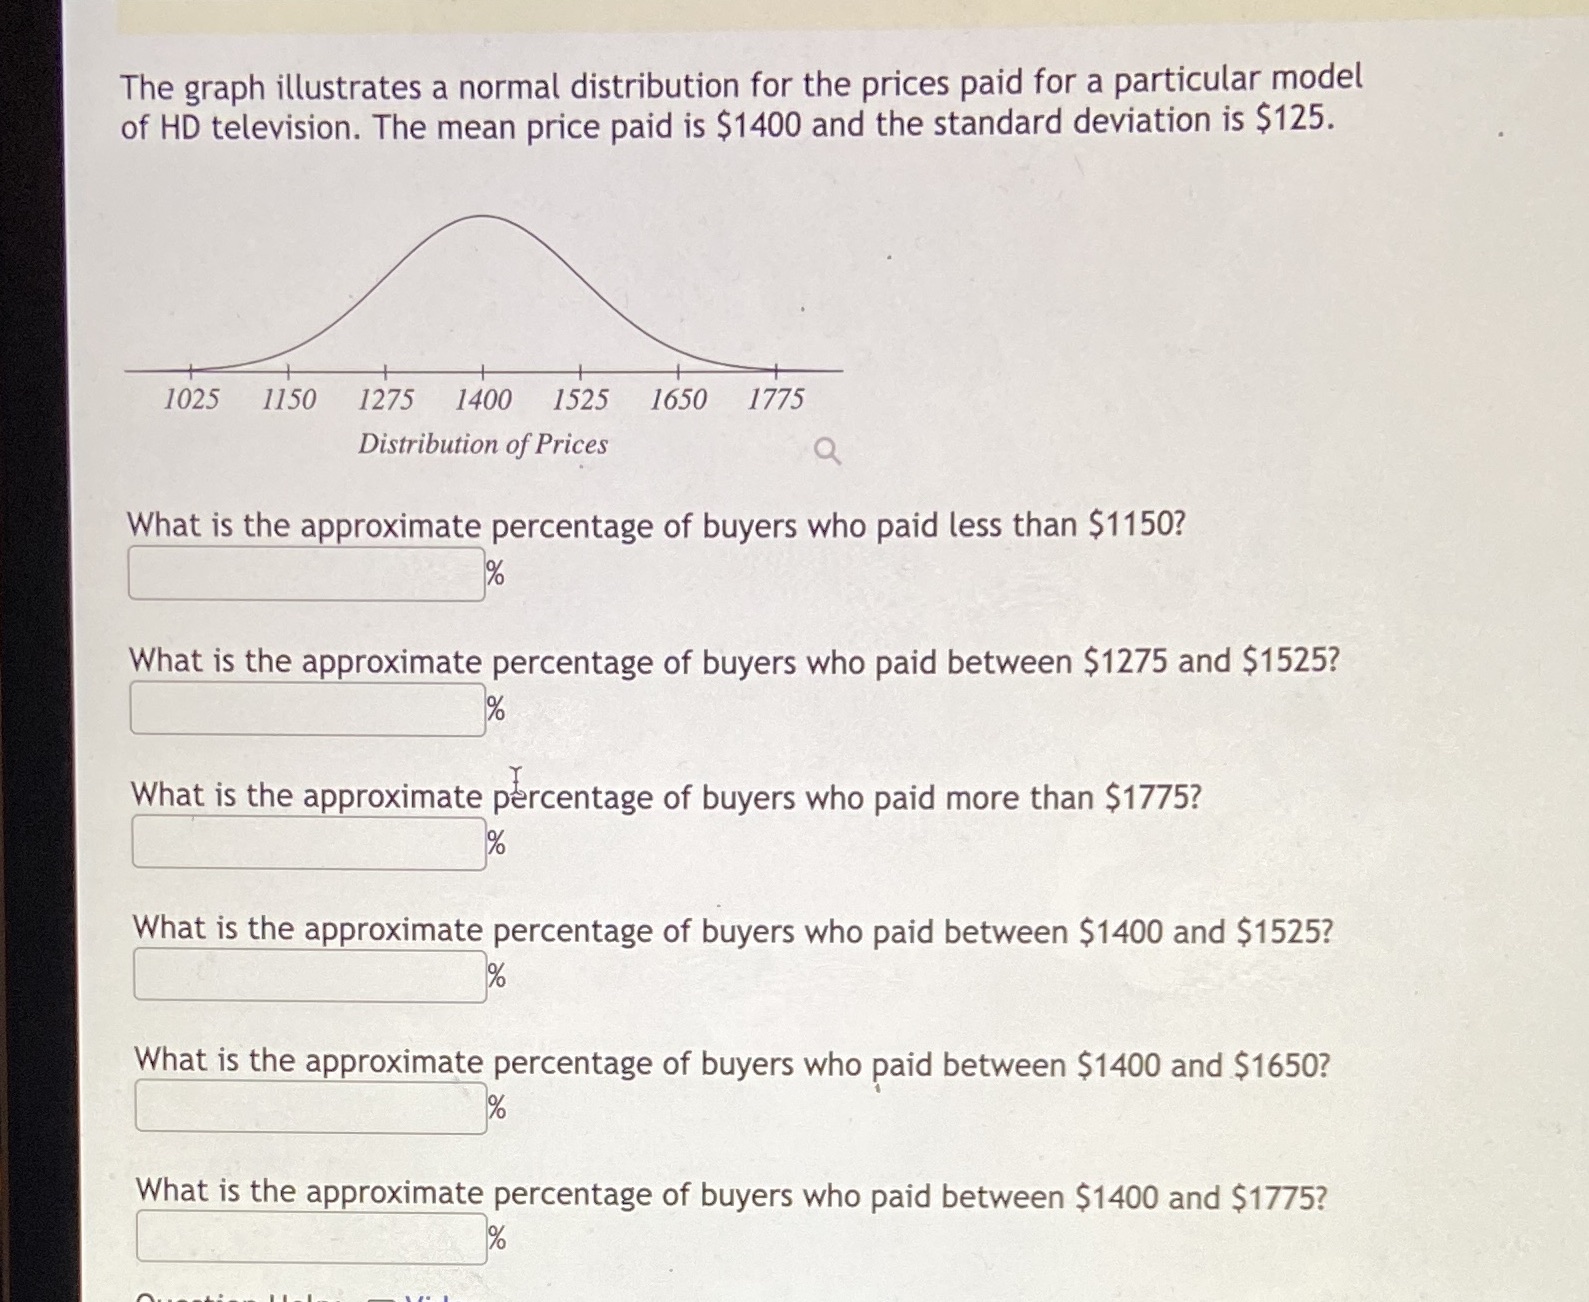
The graph illustrates a normal distribution for the prices paid for a particular model of HD television. The mean price paid is $1400 and the standard dewation is $125. 1025 1150 1275 1400 I525 I650 I775 Distriburion of Prices Q What is the approximate percentage of buyers who paid less than $1150? What is the approximate percentage of buyers who paid between $1275 and $1525? :96 What is the approximate percentage of buyers who paid more than $1775? :96 What is the approximate percentage of buyers who paid between $1400 and 51525? :i94 What is the approximate percentage of buyers who paid between $1400 and $1650? :96 What is the approximate percentage of buyers who paid between $1400 and $1775? :9; n..__.l..'_.- II_I._
Step by Step Solution
There are 3 Steps involved in it

Get step-by-step solutions from verified subject matter experts