

Question: IN ONE MATLAB CODE PLEASE. FOR PROBLEM 2: Add a title to the plot. Write the function as the title of the plot. Font of
IN ONE MATLAB CODE PLEASE.
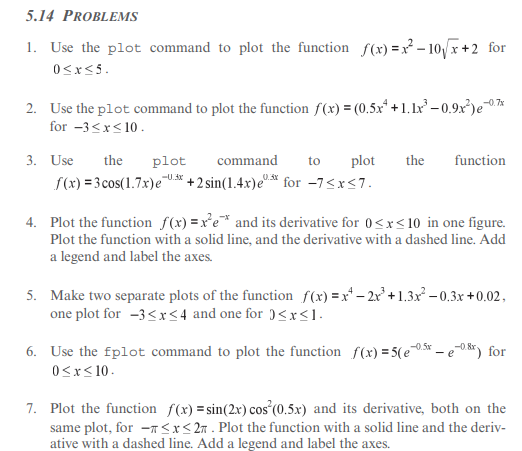
FOR PROBLEM 2:
- Add a title to the plot. Write the function as the title of the plot.
- Font of the title: Arial
- Size of the title: 22
- Plot the function with a red solid line with a width of 2
- Plot the derivative with a blue dashed line with a width of 1.5
- Add xlabel and ylabel to the plot.
- Write the functions y1=f(x) and y2=f'(x) as the ylabel.
- Write the variable x as the xlabel.
- The font and sizes of the xlabel and ylabel are Arial and 20.
- Add a legend to the plot. Write the function y1=f(x) and y2=f'(x) as a legend.
- Place the legend to the bottom right position.
- Add a grid to the plot.
- Use a spacing of 0.01 in x
FOR PROBLEM 7:
- Add a title to the plot. Write the function as the title of the plot.
- Font of the title: Arial
- Size of the title: 22
- Plot the function with a red solid line with a width of 2
- Plot the derivative with a blue dashed line with a width of 1.5
- Add xlabel and ylabel to the plot.
- Write the functions y1=f(x) and y2=f'(x) as the ylabel.
- Write the variable x as the xlabel.
- The font and sizes of the xlabel and ylabel are Arial and 20.
- Add a legend to the plot. Write the function y1=f(x) and y2=f'(x) as a legend.
- Place the legend to the bottom right position.
- Add a grid to the plot.
- Use a spacing of 0.01 in x
5.14 PROBLEMS 1. Use the plot command to plot the function f(x) = x2 - 10/2+2 for 0
Step by Step Solution
There are 3 Steps involved in it
1 Expert Approved Answer
Step: 1 Unlock

Question Has Been Solved by an Expert!
Get step-by-step solutions from verified subject matter experts
Step: 2 Unlock
Step: 3 Unlock