

Question: In Problems 3 7 and 3 8 , the three points in the table are on the graph of the indicated function f . Do
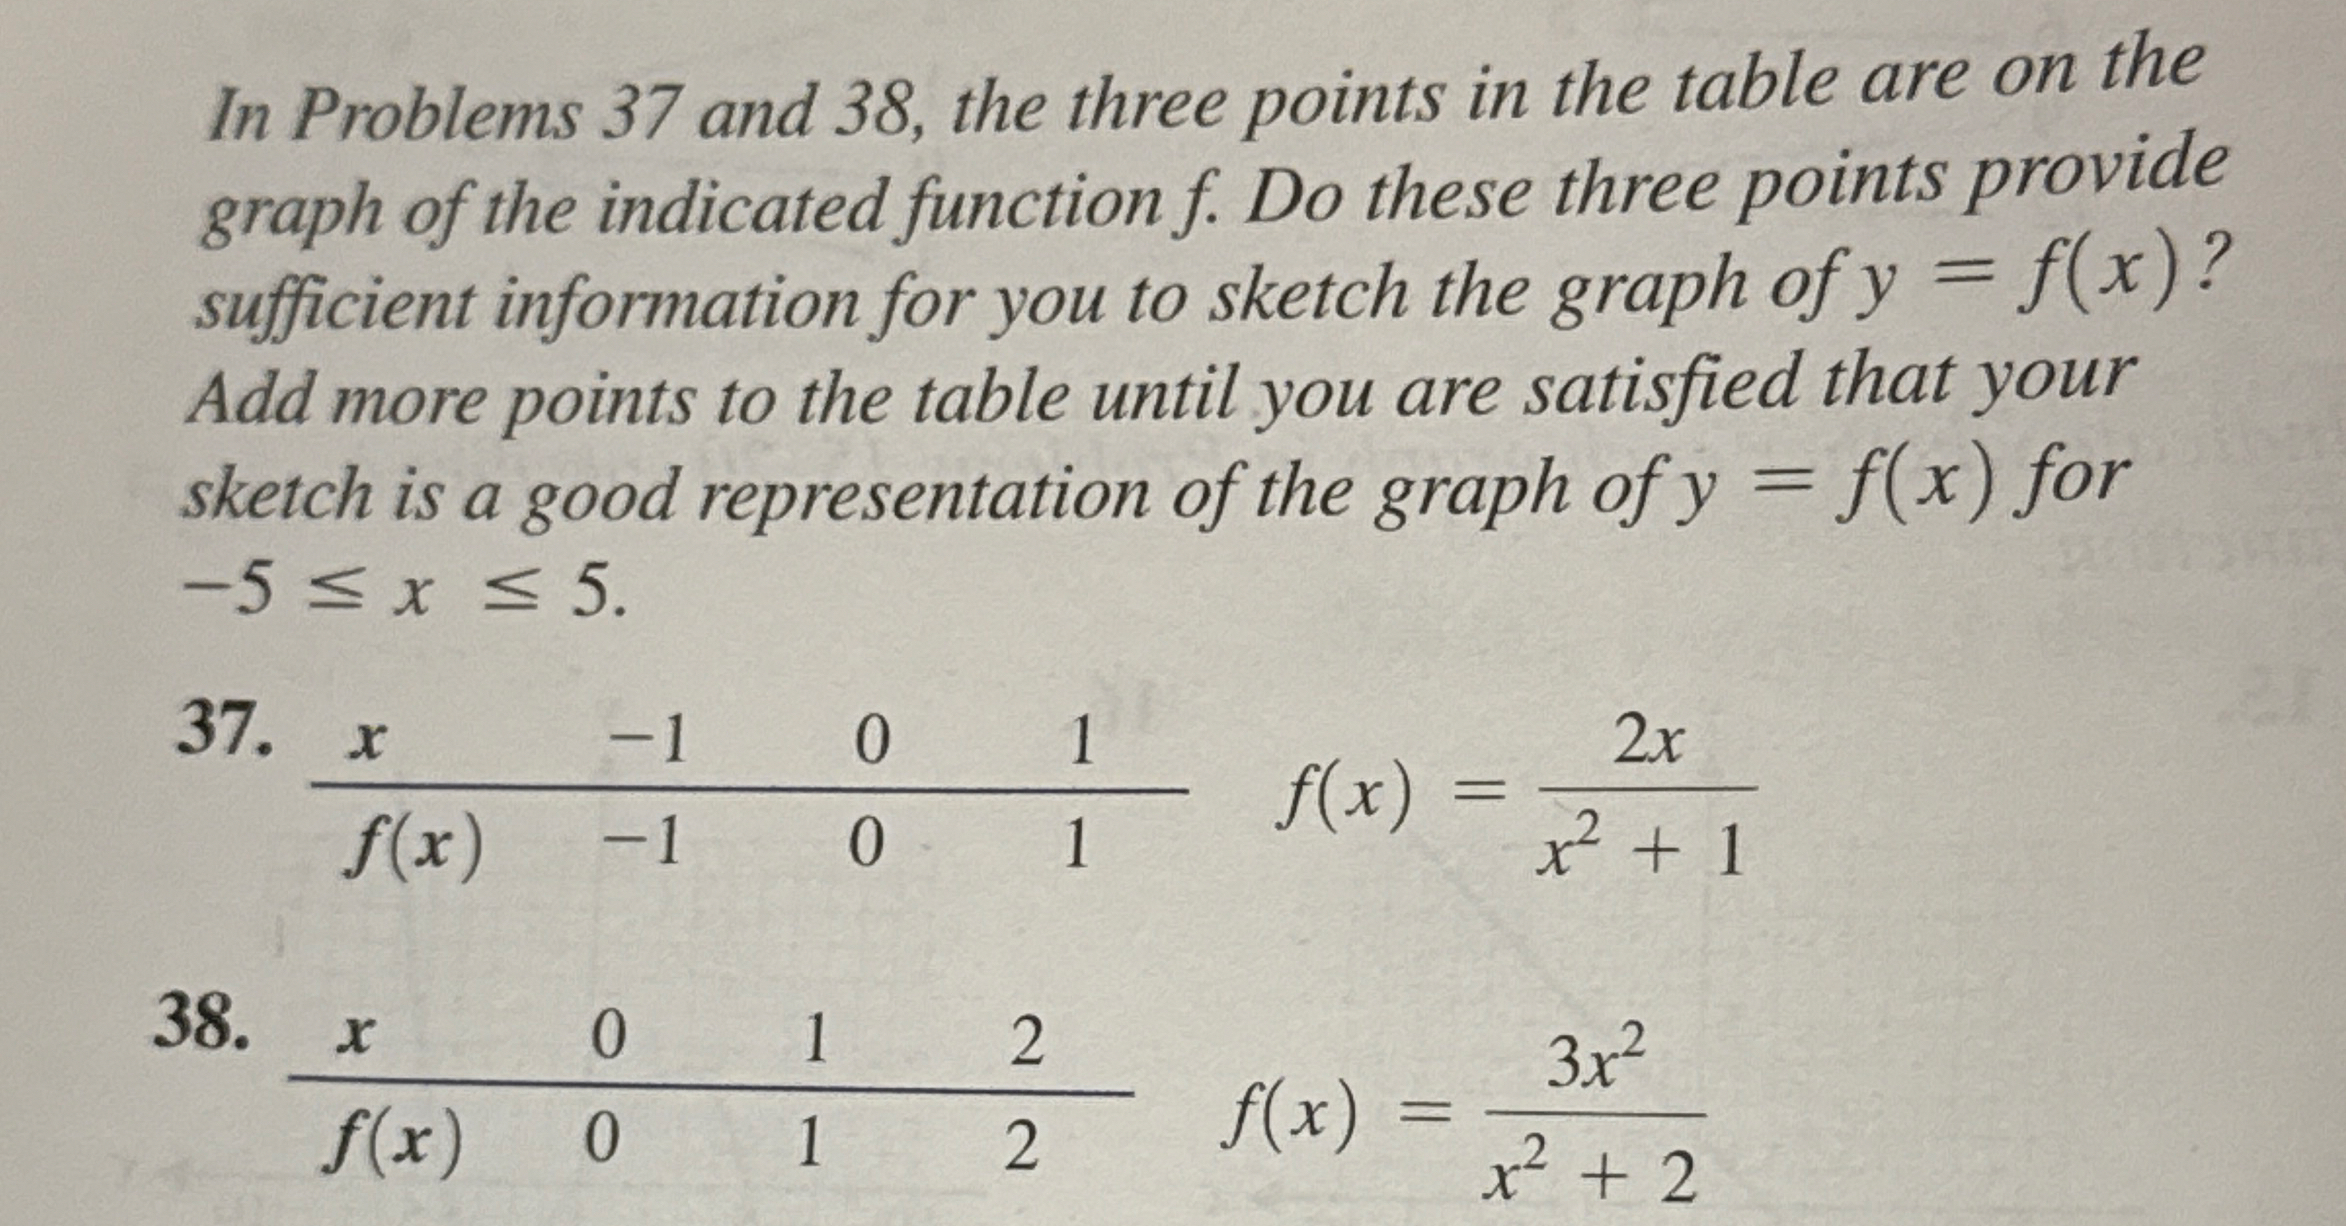
In Problems and the three points in the table are on the graph of the indicated function Do these three points provide sufficient information for you to sketch the graph of Add more points to the table until you are satisfied that your sketch is a good representation of the graph of for
table
table
Step by Step Solution
There are 3 Steps involved in it
1 Expert Approved Answer
Step: 1 Unlock

Question Has Been Solved by an Expert!
Get step-by-step solutions from verified subject matter experts
Step: 2 Unlock
Step: 3 Unlock