

Question: in python heres the csv file in word https://docs.google.com/document/d/1bDJVR2MqWKInvw5u0r3fOG3-CBmu3BEiPZwlaq_CShQ/edit?usp=sharing Building on your program from last week, you will again read in weather data from the
in python
heres the csv file in word
https://docs.google.com/document/d/1bDJVR2MqWKInvw5u0r3fOG3-CBmu3BEiPZwlaq_CShQ/edit?usp=sharing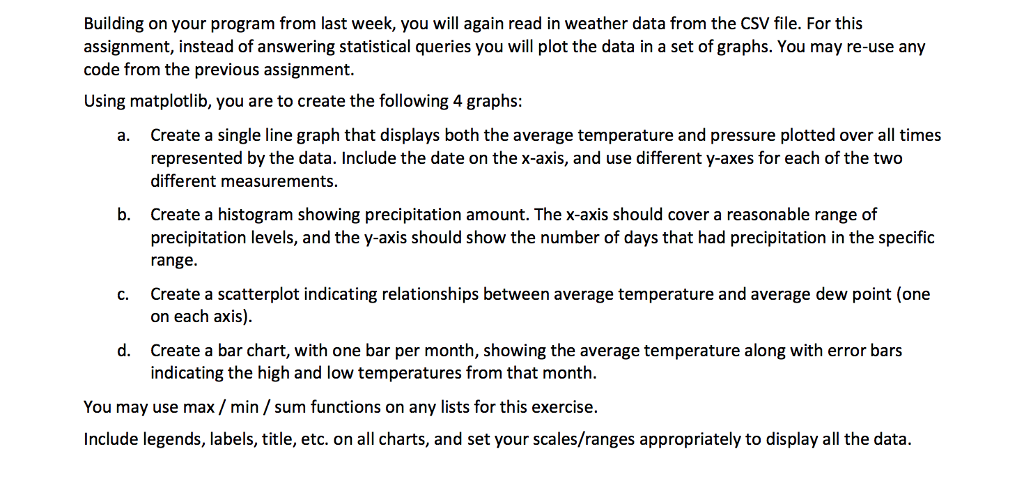
Building on your program from last week, you will again read in weather data from the CSV file. For this assignment, instead of answering statistical queries you will plot the data in a set of graphs. You may re-use any code from the previous assignment. Using matplotlib, you are to create the following 4 graphs: Create a single line graph that displays both the average temperature and pressure plotted over all times represented by the data. Include the date on the x-axis, and use different y-axes for each of the two different measurements. a. Create a histogram showing precipitation amount. The x-axis should cover a reasonable range of precipitation levels, and the y-axis should show the number of days that had precipitation in the specific range. b. Create a scatterplot indicating relationships between average temperature and average dew point (one on each axis) Create a bar chart, with one bar per month, showing the average temperature along with error bars indicating the high and low temperatures from that month. c. d. You may use max / min /sum functions on any lists for this exercise. Include legends, labels, title, etc. on all charts, and set your scales/ranges appropriately to display all the data. Building on your program from last week, you will again read in weather data from the CSV file. For this assignment, instead of answering statistical queries you will plot the data in a set of graphs. You may re-use any code from the previous assignment. Using matplotlib, you are to create the following 4 graphs: Create a single line graph that displays both the average temperature and pressure plotted over all times represented by the data. Include the date on the x-axis, and use different y-axes for each of the two different measurements. a. Create a histogram showing precipitation amount. The x-axis should cover a reasonable range of precipitation levels, and the y-axis should show the number of days that had precipitation in the specific range. b. Create a scatterplot indicating relationships between average temperature and average dew point (one on each axis) Create a bar chart, with one bar per month, showing the average temperature along with error bars indicating the high and low temperatures from that month. c. d. You may use max / min /sum functions on any lists for this exercise. Include legends, labels, title, etc. on all charts, and set your scales/ranges appropriately to display all the data
Step by Step Solution
There are 3 Steps involved in it

Get step-by-step solutions from verified subject matter experts